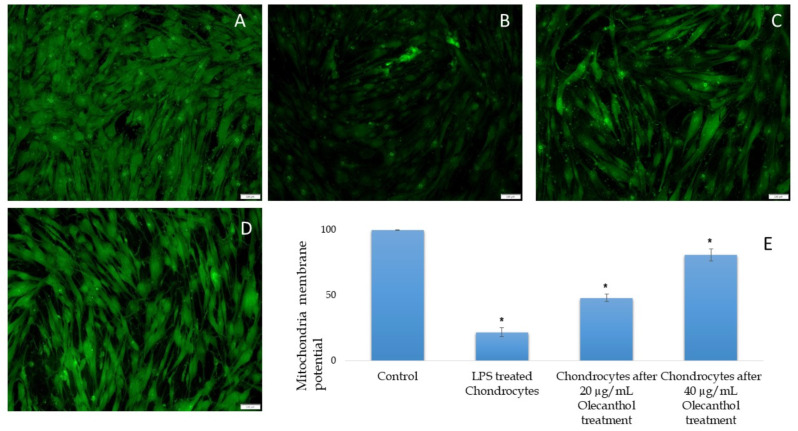
Fig. 7.
Impact of Oleocanthal on Mitochondrial Membrane Potential (ΔΨM) in Chondrocytes as Demonstrated by Immunofluorescence Staining and Quantitative Analysis. Oleocanthal’s effects on mitochondrial membrane potential (ΔΨM) within chondrocytes through both qualitative and quantitative lenses. Each part is explained as follows: (A) Immunofluorescence staining of untreated control chondrocytes, illustrating the baseline ΔΨM; (B) Chondrocytes treated with lipopolysaccharide (LPS), showing altered ΔΨM as a model of inflammation-induced mitochondrial stress; (C) Chondrocytes after treatment with 20 µg/mL oleocanthal, indicating the effect of oleocanthal on the preservation/restoration of ΔΨM; (D) Chondrocytes post-treatment with 40 µg/mL oleocanthal, further depicting the dose-response relationship between oleocanthal and ΔΨM stabilization; (E) Quantitative bar graph of ΔΨM intensity, normalized to the control, across the different treatment groups. Student’s t-test was conducted to assess statistical significance. A single asterisk (*) denotes a p-value less than 0.05 (Note: The fluorescence images reveal that LPS treatment reduces ΔΨM, indicative of mitochondrial depolarization, which is then partially reversed by oleocanthal treatment in a concentration-dependent manner. The quantitative analysis corroborates the protective effect of oleocanthal on mitochondrial integrity under inflammatory conditions.)

