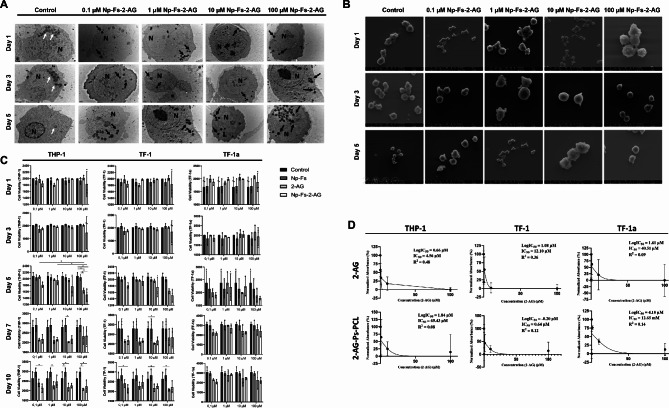
Fig. 3.
Ultrastructural morphology of THP-1 cells and viability of THP-1, TF-1 and TF-1a cells maintained in culture with 2-AG-Ps-PCL nanoparticles. A TEM micrographs of THP-1 monocytes incubated with 2-AG-Ps-PCL nanoparticles on days 1, 3 and 5. Vesicles in the control cells are indicated by white arrows, and electron-dense vesicles in the experimental groups are shown in micrographs with black arrows at 12,000×. B SEM micrographs of THP-1 monocytes incubated with 2-AG-Ps-PCL nanoparticles on days 1, 3 and 5. C The effects of the 2-AG-Ps-PCL nanoparticles and control groups on THP-1, TF-1 and TF-1a hematopoietic cell viability are shown in a bar graph, *p < 0.05 by one-way analysis of variance (ANOVA) (n = 3, ±SD). D Dose-inhibition response curve and logIC50, IC50 and R2 values for 2-AG and 2-AG-Ps-PCL in the THP-1, TF-1 and TF-1a cell lines (n = 3, ±S.E.M.)

