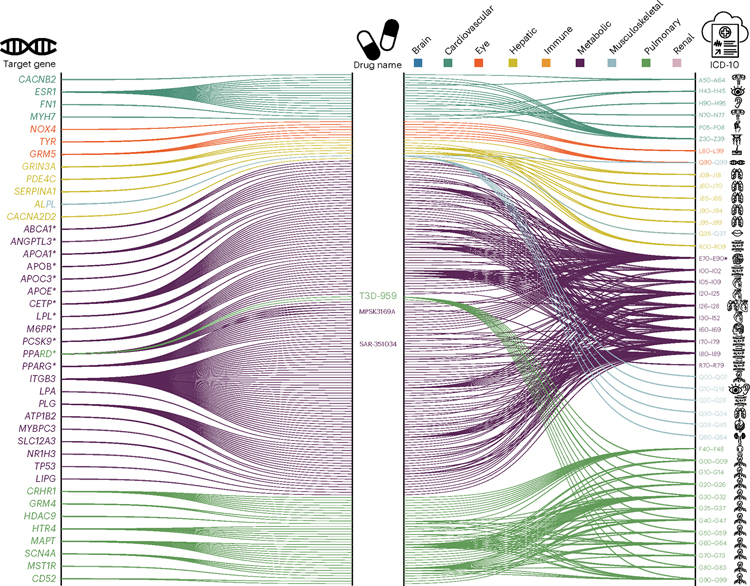
Fig. 4 |. Gene–drug–disease network of the nine BAGs.
The gene–drug–disease network reveals a broad spectrum of gene, drug and disease interactions across the nine BAGs, highlighting the metabolic-related genes. The ICD-10 code icons symbolize disease categories linked to the primary organ systems (for example, G30 for Alzheimer’s disease in the CNS). All presented genes passed the nominal P value threshold (<0.05; two sided) and were pharmacogenetically associated with drug categories in the DrugBank database; an asterisk (*) indicates gene–drug–disease interactions that passed the Bonferroni correction.

