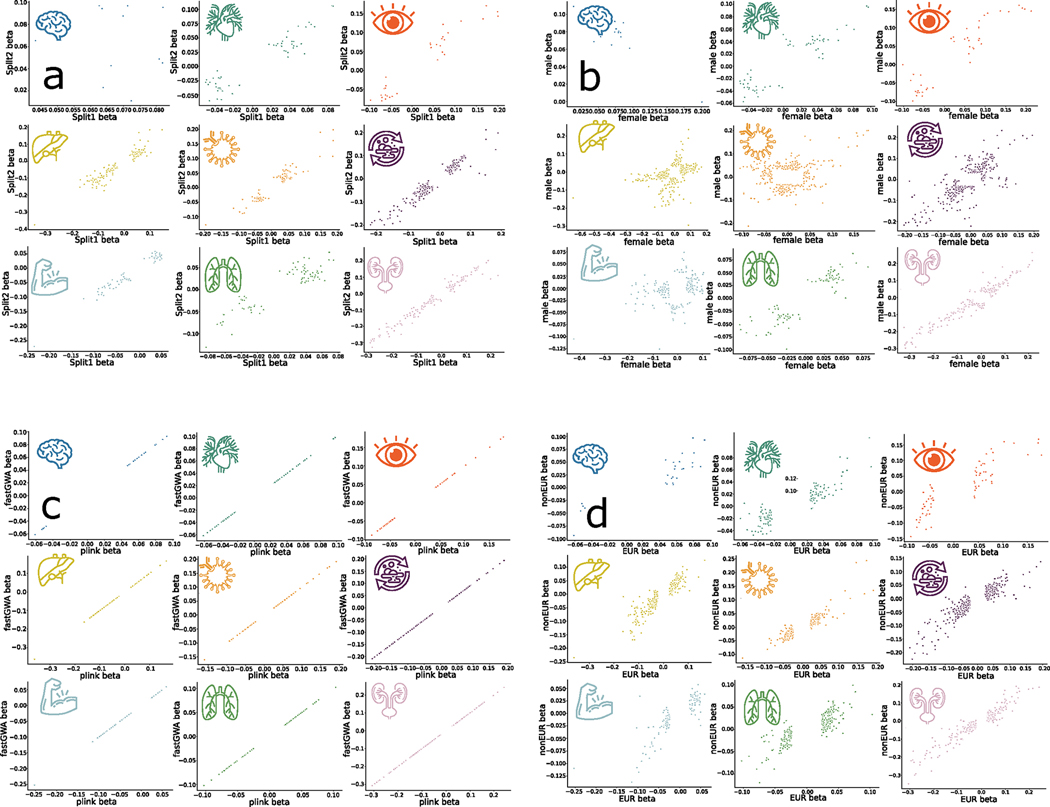
Extended Data Fig. 1 |. Scatterplots of the main GWAS sensitivity analysis for nine BAGs.
We scrutinized the robustness of the nine primary GWAS using the European ancestry populations by fully considering linkage disequilibrium. We only included the independent significant SNPs in four different sensitivity check analyses. We reported three statistics i) r-β: Pearson’s r between the two sets of β coefficients from the two splits; ii) C-β: concordance rate of the sign of the β coefficients from the two splits – if the same SNP exerts the same protective/risk effect between the two splits; iii) P-β: the difference between the two sets of β coefficients from the two splits – if the two sets of β coefficients (mean) statistically differ (two-sample t-test). Detailed statistics are presented in Supplementary Note 1 for a) split-sample, b) sex-stratified, c) fastGWA vs. PLINK, and d) European vs. Non-European GWAS analyses.

