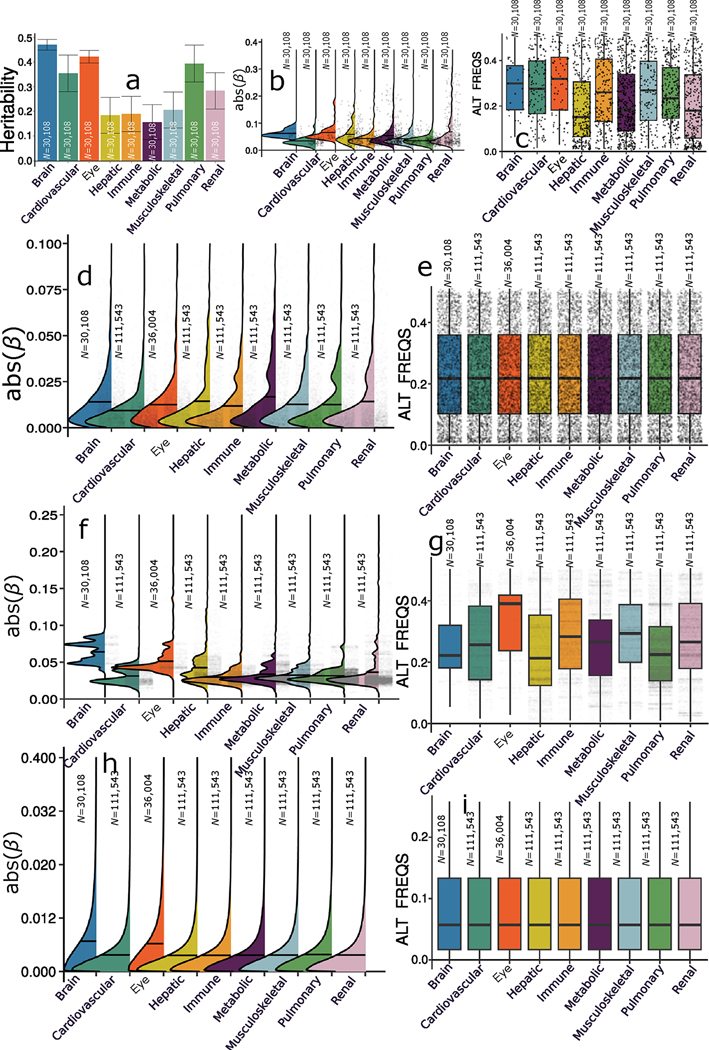
Extended Data Fig. 2 |. SNP-based heritability, beta coefficients, and alternative allele frequency using the brain-BAG comparable populations and different inclusion criteria for the SNPs.
a) The SNP-based heritability of the nine BAGs using populations from downsampling to the brain BAG population. Error bars represent the standard error of the estimated parameters, and the measure of the center for the error bars represents the inferred statistics (that is, SNP-based heritability). b) The absolute value of the beta coefficients of the independent significant SNPs of the nine BAG GWASs using populations from downsampling to the brain BAG population (N = 30,108); the independent significant SNPs are shown separately for each BAG. c) The alternative (effective) allele frequency of the independent significant SNPs from the nine BAG GWASs using populations from downsampling to the brain BAG population (N = 30,108). d) The beta coefficients of the independent significant SNPs using the original full samples but with all identified independent significant SNPs across the nine BAG GWASs (with the same number of SNPs tested), where we see no difference regarding allele frequency in Figure e). f) The absolute value of the beta coefficients of the independent significant SNPs plus the candidate SNPs in LD of the nine BAG GWASs using the original full samples; the SNPs are shown separately for each BAG. g) The alternative allele frequency for the setting in Figure f). h) The absolute beta coefficients of the nine BAGs using all genome-wide SNPs (the y-axis was truncated to 0.1 for visualization purposes). i) the alternative allele frequency did not differ for Figure h) including all genome-wide SNPs. For Figure c, e, g, and i, the upper/lower whiskers show the upper/lower boundaries based on the 1.5xthe interquartile range (IQR). The upper/lower hinge displays the top/bottom end of the IQR. The central measures denote the median values.

