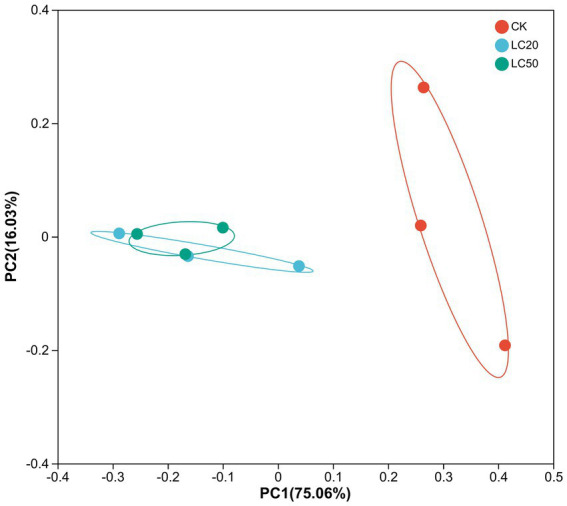
Figure 5.

Principal coordinate analysis (PCoA) of bacterial communities in L. dispar from different groups based on unifrac distances. CK: control group; LC20: treatment group with 0.0297 mg/mL of CAR; LC50: treatment group with 1.120 mg/mL of CAR. The numbers 1–3 following the sample names represent different replicates, respectively.
