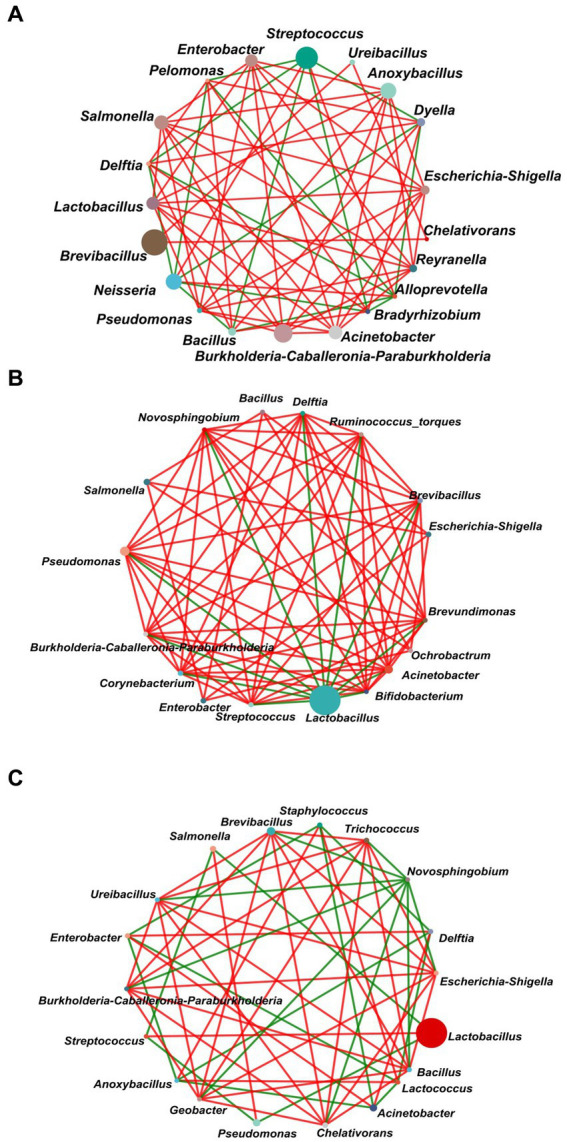
Figure 7.

Network analysis of the dominant genera (top 20) of the gut bacterial communities of L. dispar in three groups. (A) CK: control group; (B) LC20: treatment group with 0.0297 mg/mL of CAR; (C) LC50: treatment group with 1.120 mg/mL of CAR. The size of nodes in the figure represents the abundance of species, and different colors represent different species. The color of the line indicates positive and negative correlation, red indicates positive correlation, green indicates negative correlation; The more lines there are, the more closely related the species is to other species. When a correlation coefficient exceeds 0.6 and p < 0.05, the relationships are kept.
