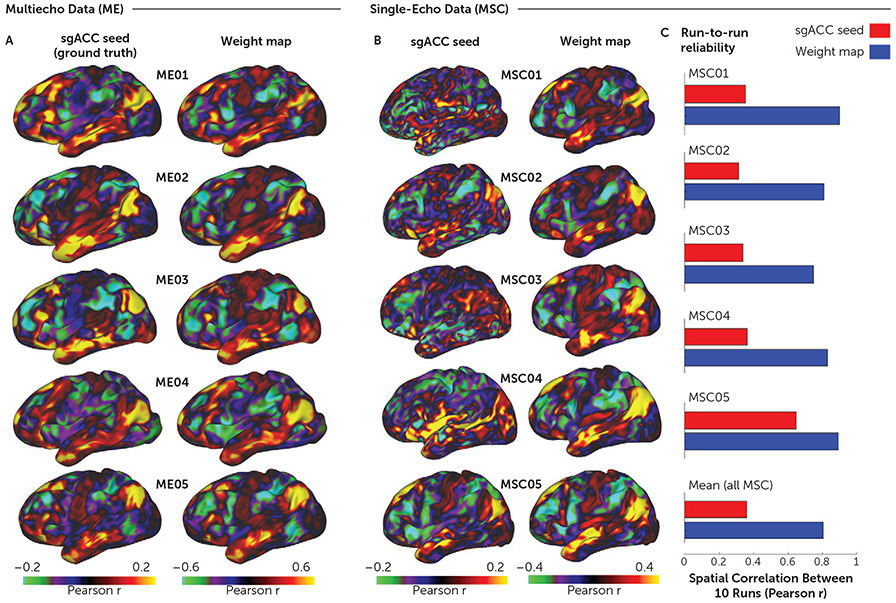
FIGURE 1. Reliability and accuracy of determining subgenual anterior cingulate cortex (sgACC) functional connectivity (FC) with the weight-map methoda.
a We used multiecho fMRI data (ME) to investigate how accurately the weight-map method approximates true sgACC functional connectivity (FC). Panel A shows cortical surface maps depicting sgACC FC for five densely sampled subjects (ME01–ME05), each with up to 15 hours of concatenated multiband multiecho fMRI data. Because the simple sgACC seed yielded reliable FC maps in the concatenated multiecho fMRI data (22), we were able to test how accurately the FC maps derived from the weight-map approach (right column) approximated the “ground truth” sgACC seed-derived FC maps (left column). Qualitatively, there was a high correspondence between the FC maps generated by the two methods. The median spatial correlation (r) between the resulting maps for the two methods was 0.95. As shown in panel B, we next tested the performance of the weight-map method with single-echo fMRI data from the publicly available Midnight Scan Club (MSC) data set (21) that consists of data from 10 densely sampled individuals, each with 10 30-minute single-echo fMRI scans. Cortical surface maps depict FC for all MSC subjects from concatenated time series (5 hours) derived from either a simple sgACC seed (left column) or the weight-map method (right column). Maps derived from the sgACC seed were very noisy, whereas the weight-map method yielded FC maps with a consistent default mode network-like network configuration resembling the multiecho results. Note that the weight-map method produced higher absolute FC values with both the MSC and ME data sets. Panel C shows the test-retest reliability in terms of the mean spatial correlation (r) across each subject’s 10 fMRI sessions for a simple spherical sgACC seed (red) and the weight-map method (blue). Note the consistent improvement in reliability with the weight-map method across subjects, with a mean improvement from r=0.38 to r=0.81 for the total sample. Panels B and C show results for only five of 10 MSC subjects; results of the entire sample are shown in Figure S4 in the online supplement.

