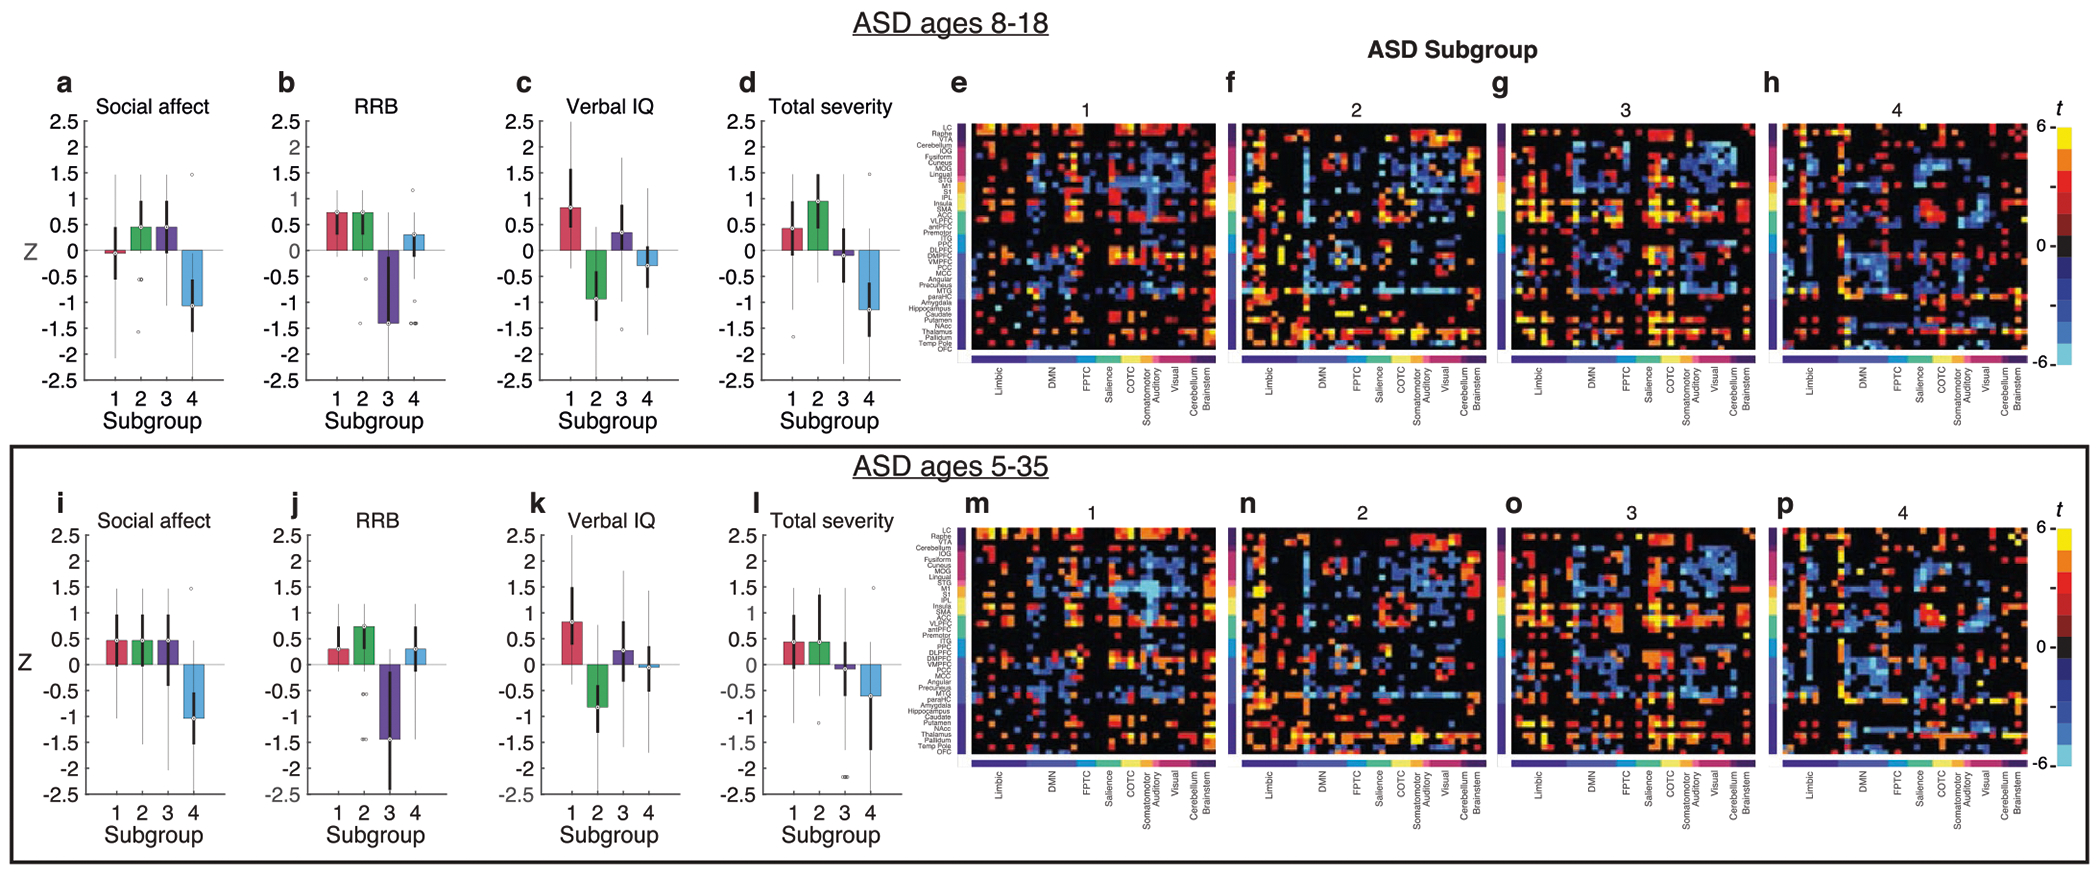
Extended Data Fig. 5 |. RCCA and clustering analysis using narrower age range (ages 8–18) yields ASD subgroups with clinical symptoms and atypical connectivity consistent with main analysis.

We repeated all the main analyses (shown in box, (i-p) using a smaller age range, including only ASD and neurotypical individuals of ages 8–18 (shown in a-d and i-l). This reduced our ASD sample from N = 299 ages 5–35 to N = 243 ages 8–18 and reduced our neurotypical sample from N = 907 to N = 573. In this secondary analysis, we found similar clinical symptom profiles associated with each subgroup (a-d vs. i-l). Boxplots of the distribution of clinical symptom z-scores (superimposed bar graphs depict the median) for (a,e) social affect, (b,f) repetitive, restrictive behaviors and interests (RRB), (c,g) verbal IQ, and (d,h) total severity (color indicates subgroup). Note that higher social affect, RRB, and total severity scores and lower verbal IQ indicate greater impairment. Box bounds: [25th,75th percentile]; center: median; whiskers: 99.3% data in + /−2.7 σ; outliers: circles). Next, we found similar atypical connectivity associated with each subtype (e-h vs. m-p). (e-h) Atypical connections that were significant (P < 0.05) in the narrower age range, thresholded for significant atypical connectivity (two-sided Welch’s t-test, FDR < 0.05). (m-p) Atypical connections that were significant (P < 0.05) in the full age range, thresholded for connections that were significant in the main analysis (two-sided Welch’s t-test, FDR < 0.05). Heatmaps show patterns of atypical connectivity in each subgroup across brain regions (rows) and functional networks (columns). Thresholded for significant atypical connectivity (two-sided Welch’s t-test, FDR < 0.05), evaluated relative to N = 907 neurotypical controls. For additional results, see Supplementary Figs. 13, 14 and 17–20.
