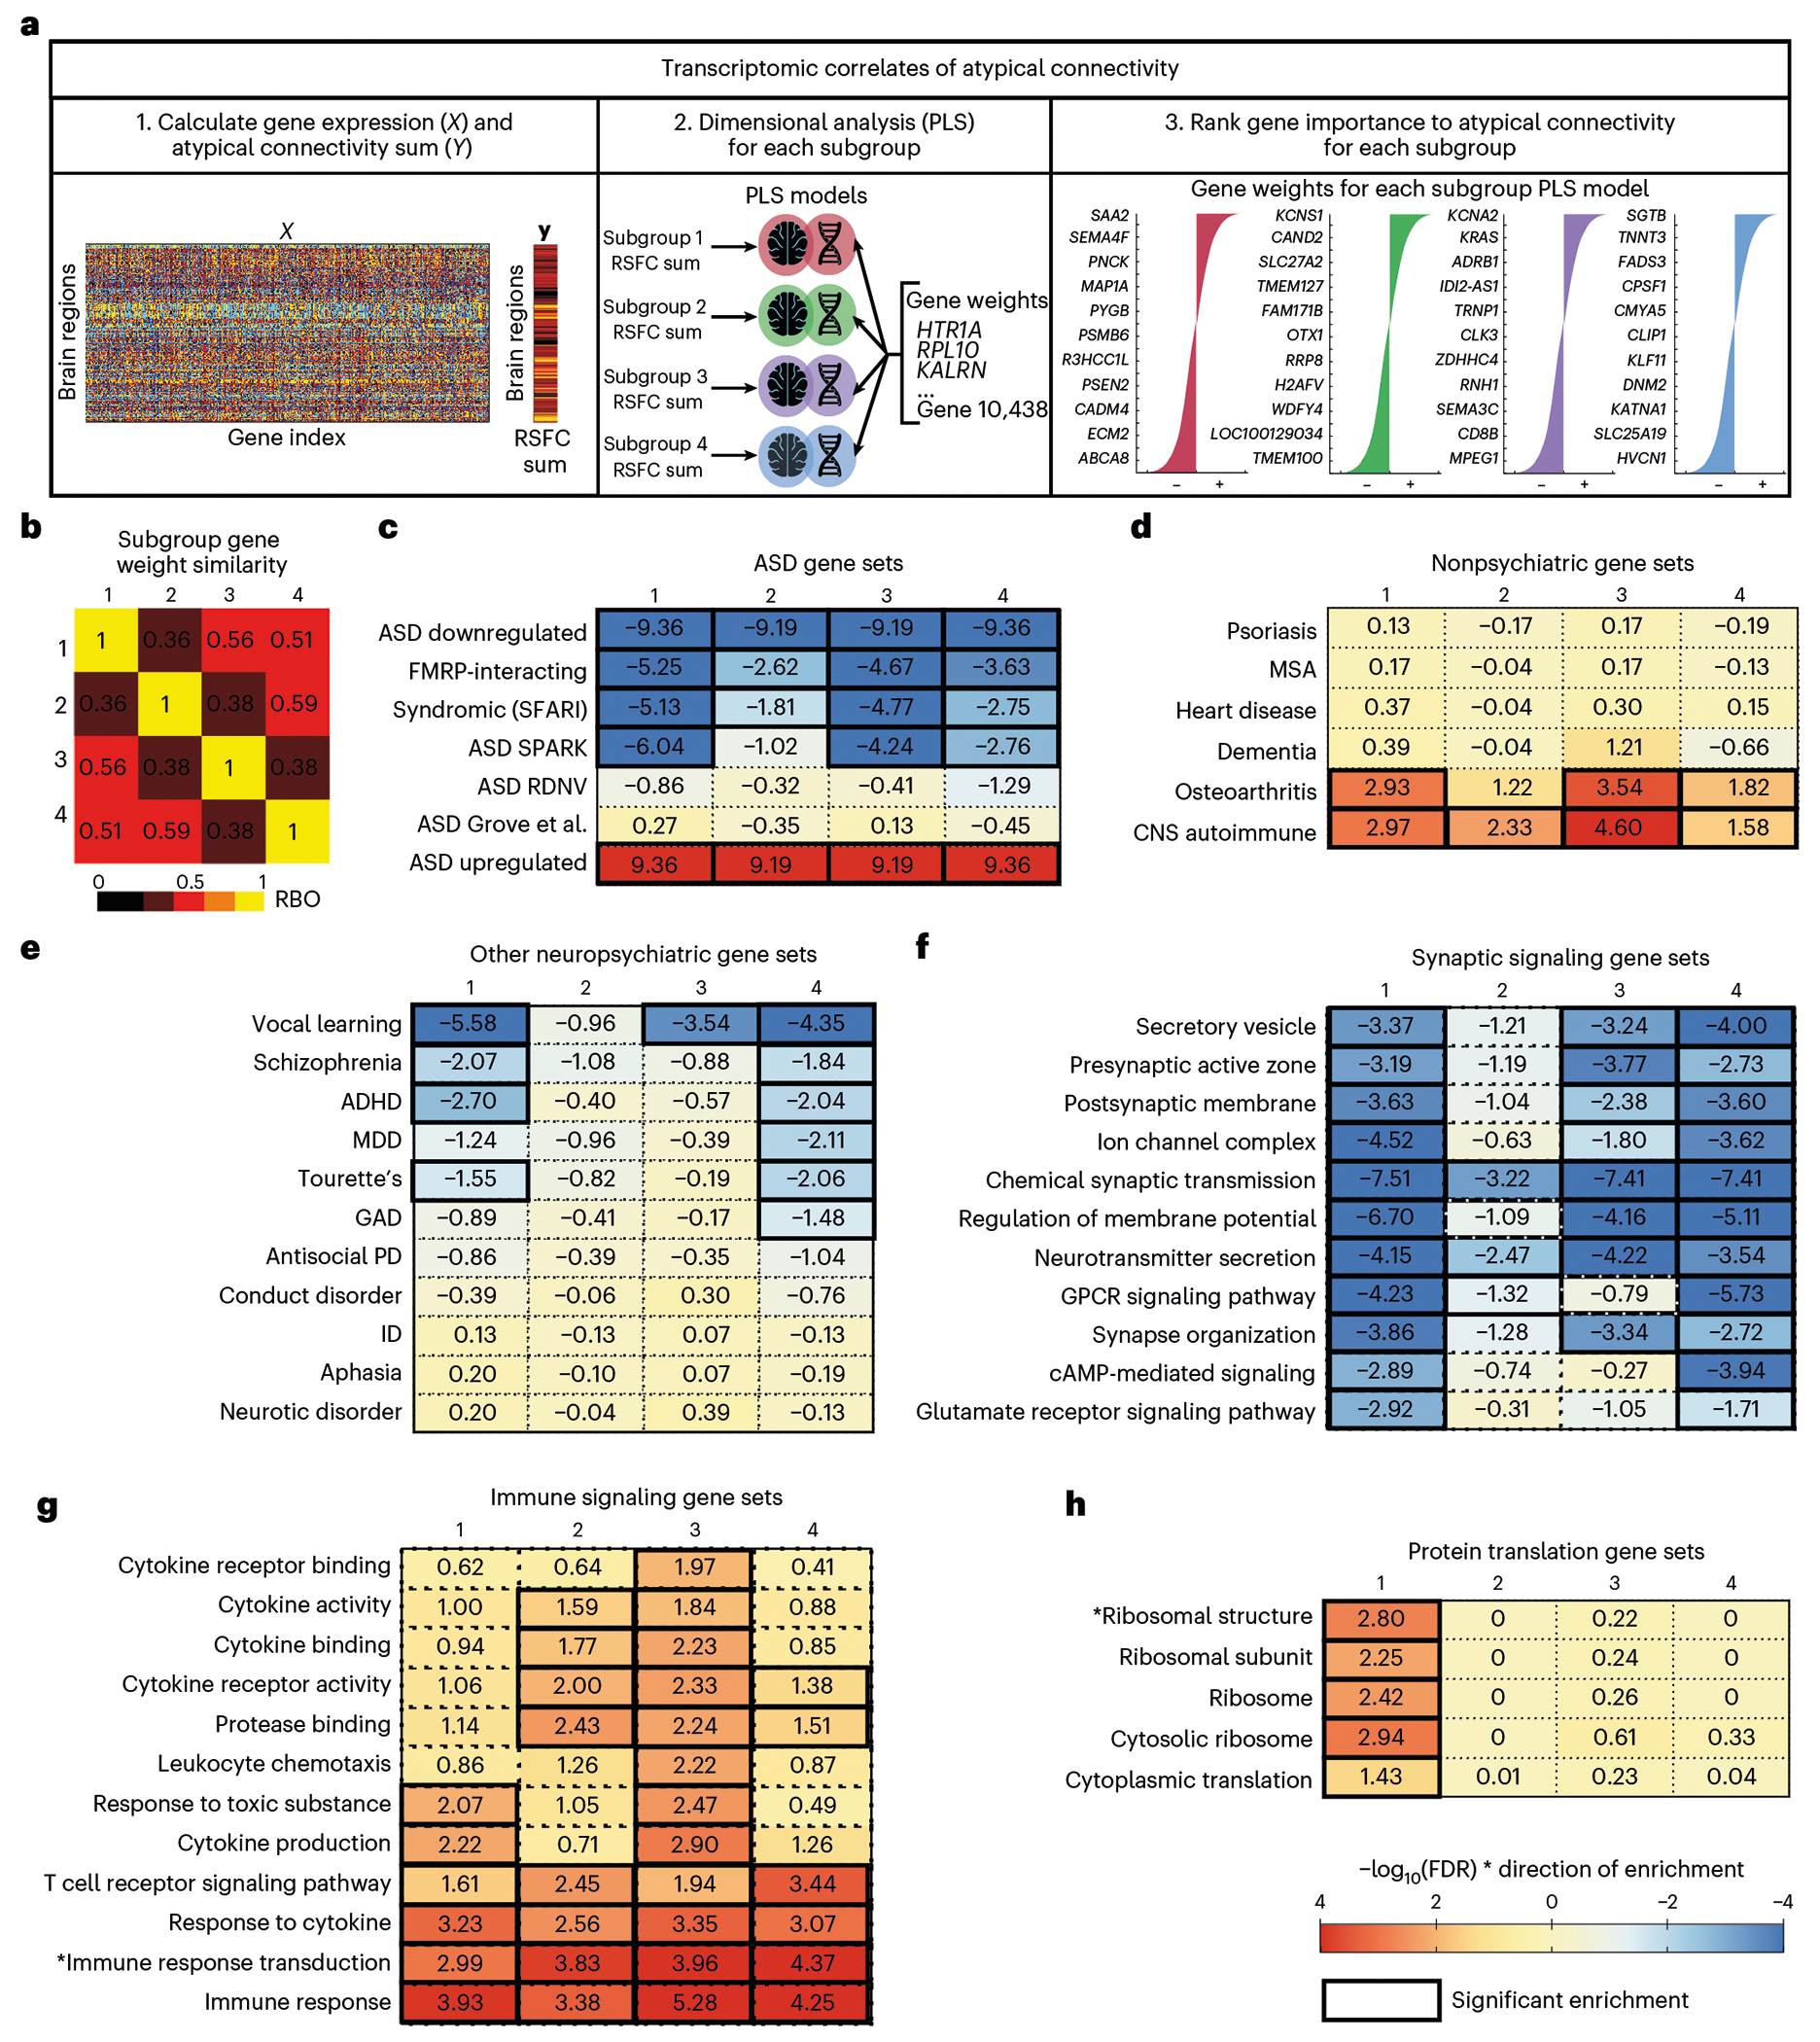
Fig. 5 |. Transcriptomic correlates of atypical connectivity patterns in autism spectrum disorder subgroups.

a, Schematic of transcriptomics analysis to test whether gene expression explains atypical connectivity in each subgroup. First, we calculated gene expression at each brain region (ROI) and atypical connectivity (RSFC) summed over ROIs for each subgroup. Second, we performed PLS regression for each subgroup and estimated the significance of each PLS model using a spatial permutation (‘spin’) test27,56. The PLS models for all four subgroups were significant (subgroup 1: P = 0.014; subgroup 2: P < 0.001; subgroup 3: P < 0.001; subgroup 4: P < 0.001; all statistics in Supplementary Table 3). Third, we ranked genes by PLS gene weights in each model. b, Heat map of similarity between subgroup gene rank lists (average of RBO for top 1,000 positively ranked genes and RBO for the top 1,000 negatively ranked genes between subgroups). Each subgroup was associated with a distinct set of genes (RBO = 0.36–0.59, 1 is perfect similarity). c–e, Heat maps of gene set enrichment for each subgroup’s ranked gene weights for ASD-related gene sets (c), nonpsychiatric disease-related gene sets (d), psychiatric disorder-related gene sets (e), synaptic signaling gene sets (f), immune signaling gene sets (g) and protein translation gene sets (h). Full GSEA results are in Supplementary Table 4. All subgroups were enriched for ASD-related gene sets, but not for unrelated diseases. Color indicates strength of negative log-transformed FDR for normalized enrichment score multiplied by the sign of the gene weight (+1 or −1). ADHD, attention-deficit/hyperactivity disorder; CNS, central nervous system; GAD, generalized anxiety disorder; GPCR, G-protein-coupled receptor; ID, intellectual disability; MDD, Major depressive disorder; MSA, multiple system atrophy; PD, personality disorder; RDNV, rare de novo variants.
