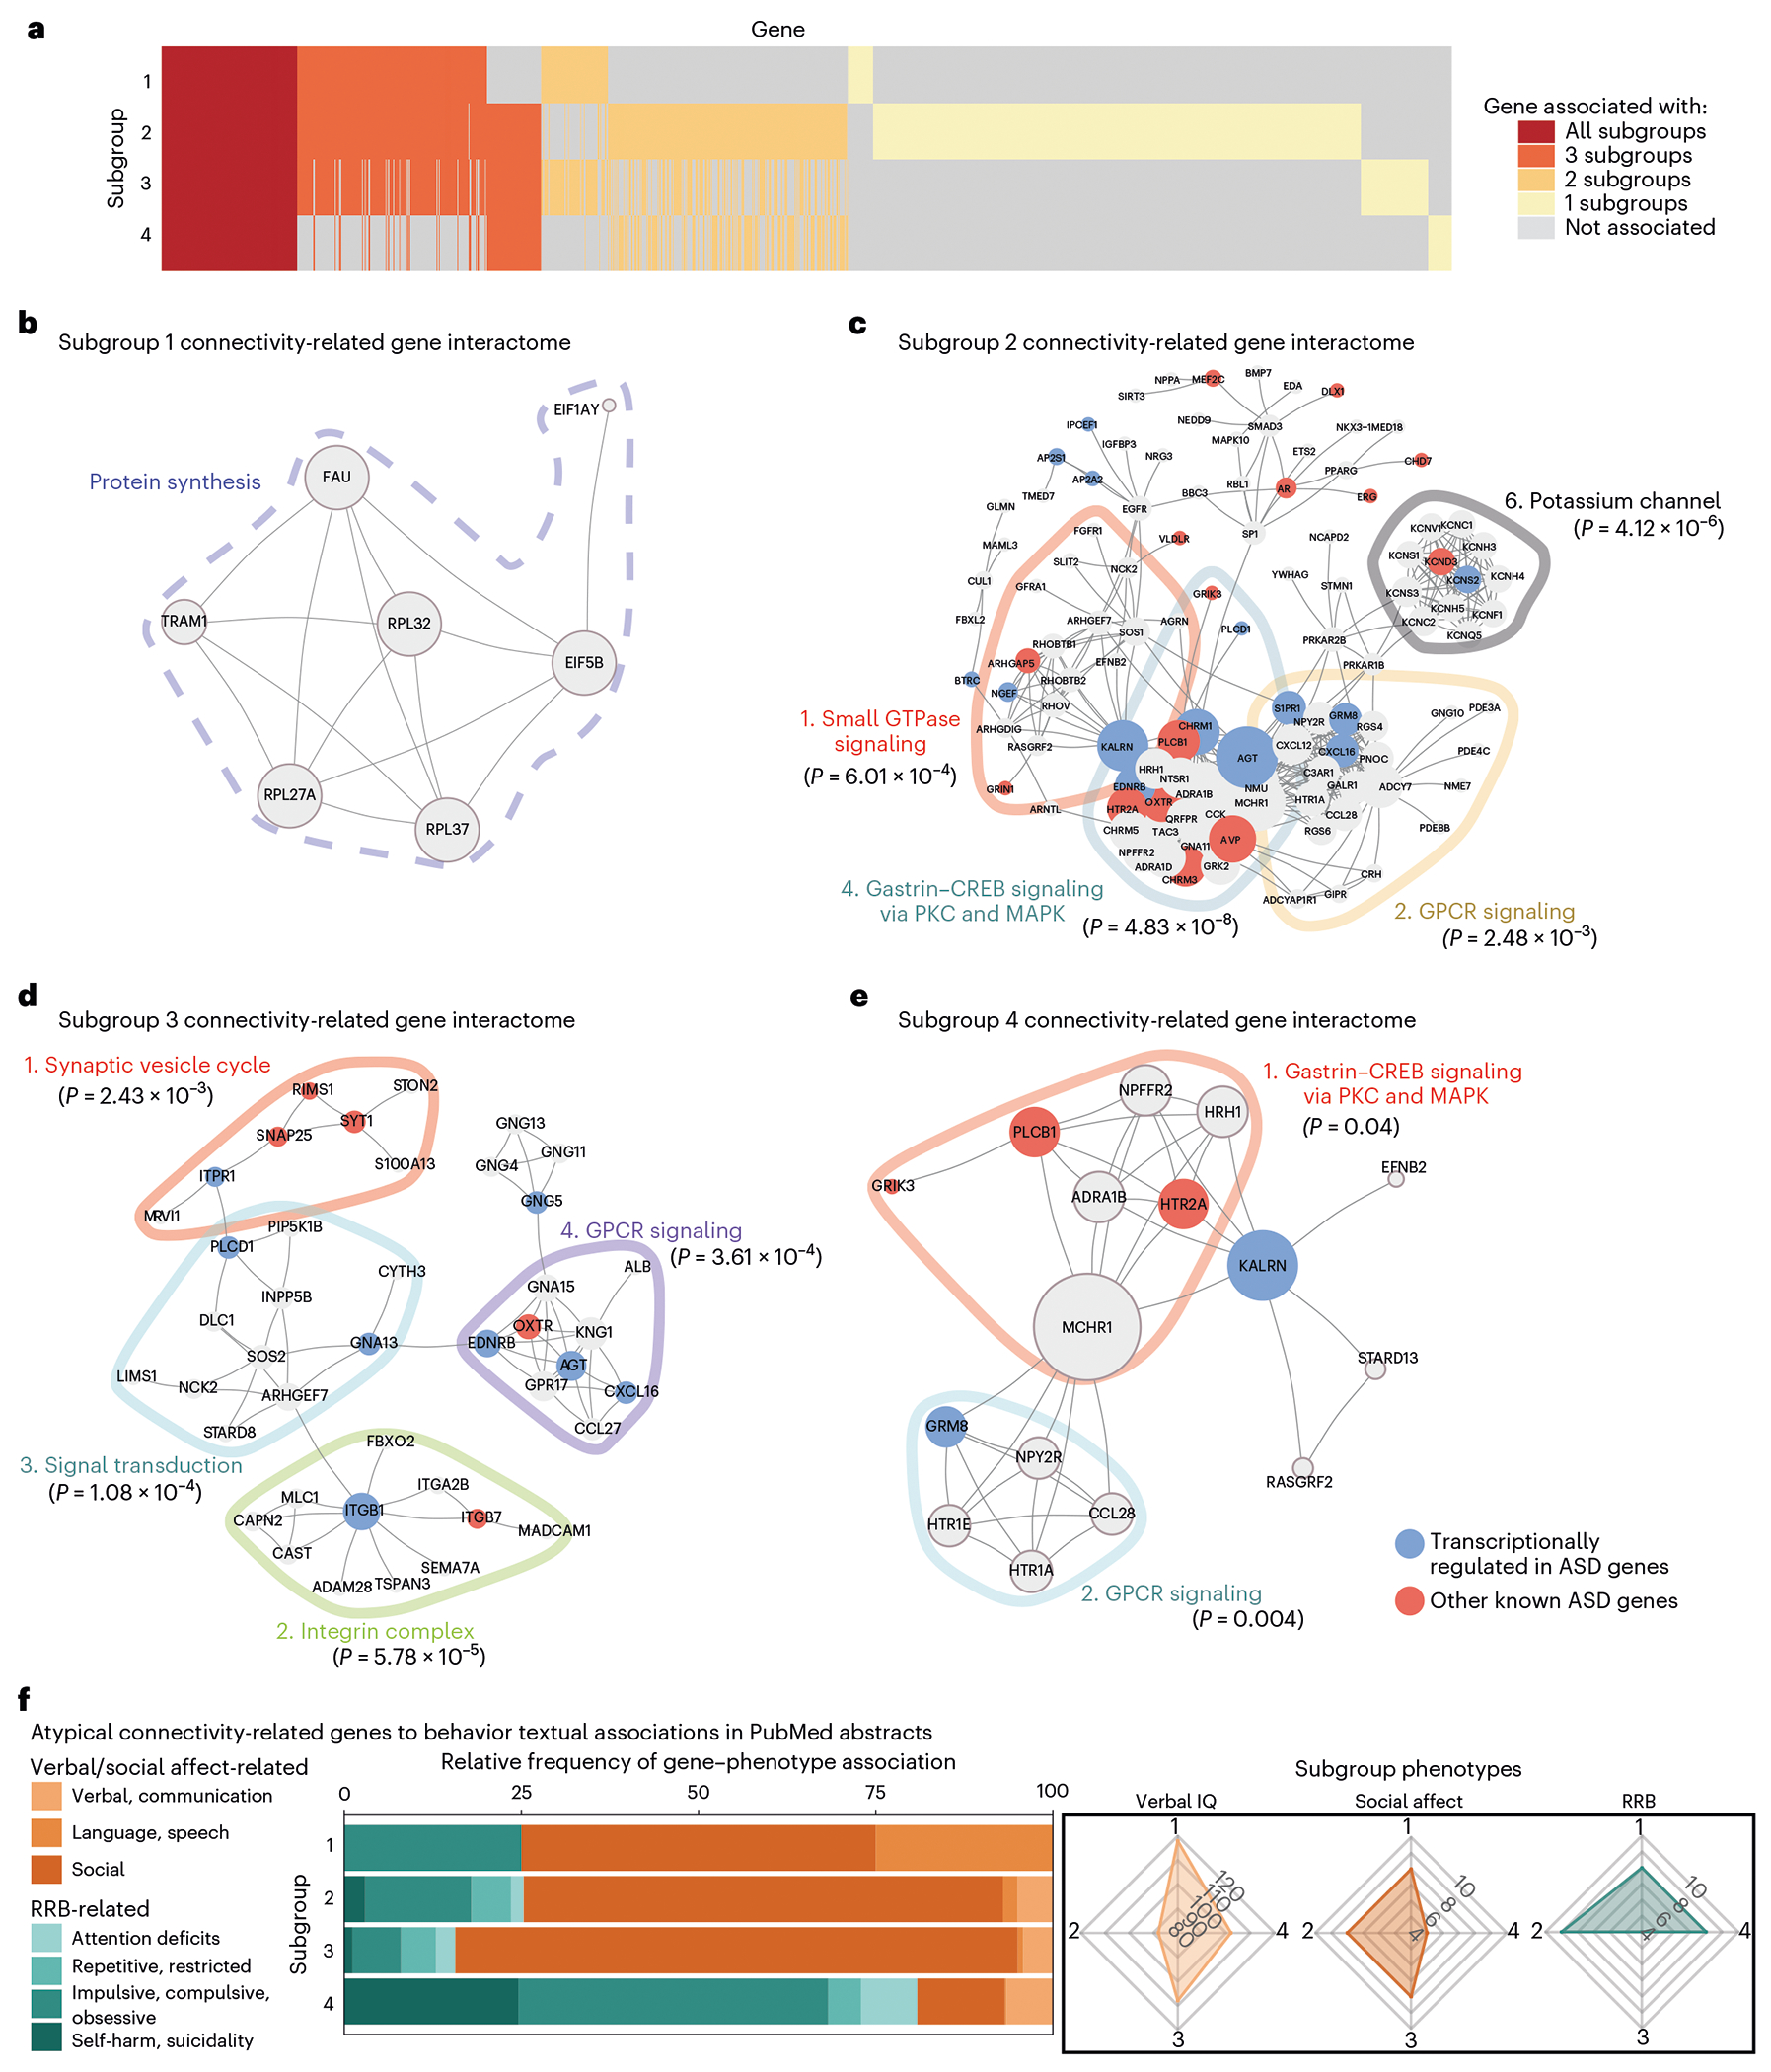
Fig. 6 |. Protein-protein interaction networks reveal distinct connectivity-related genes with textual associations to autism spectrum disorder-related behaviors.

a, Heat map of overlap between genes (y axis) significantly associated with each subgroup’s atypical connectivity (P < 0.01; Methods). Some genes were significantly associated with all four subgroups (red), while others were associated with just one, two or three subgroups (yellow, pale orange or orange). b–e, Zero-order PPI networks for genes associated with each subgroup and no more than one other subgroup (STRING database; Methods). b, Subgroup 1’s interactome was associated with protein synthesis-related genes (dashed line around genes). c–e, Subgroups 2–4 had multiple significant functional modules as determined by the Walktrap algorithm (Supplementary Table 5), delineated by colored lines around each module, and implicating G-protein-coupled receptor signaling (subgroups 2–4), transforming growth factor-beta (TGF-β) signaling (subgroup 2), synapse function and signal transduction (subgroup 3) and gastrin–CREB signaling (subgroup 4), among others. The significance of each PPI module is the two-sample Wilcoxon rank-sum test (unpaired, two-sided) of within-module degrees versus cross-module degrees (no adjustments for multiple comparisons of modules). For each gene in the module, the within-module degree is the number of connected genes within the module and the cross-module degree is the number of connected genes outside the module. f, Nested bar graph of relative frequency (for each subgroup, number of keyword-associated abstracts divided by total number of abstracts) of PubMed abstract associations between subgroup-specific hub genes (up to ten top-connected genes in subgroup PPI) and behavioral keywords. Radar charts (right) show relative distribution of clinical symptom severity between subgroups (Fig. 3b–e). Subgroup 4 (severe RRB, mild social affect) connectivity-associated hub genes were most strongly associated with RRB-related keywords (RRB-related terms for S4 = 80.85%). Subgroups 1–3 showed the opposite relationship (social affect-related terms are S1 = 75.00%, S2 = 74.71% and S3 = 84.35%). Keywords are defined in Supplementary Table 6. In g, “immune response transduction’ abbreviates the ‘immune response-activating signal transduction’ gene set and in h, ‘*ribosomal structure’ abbreviates the ‘structural constituent of ribosome’ gene set.
