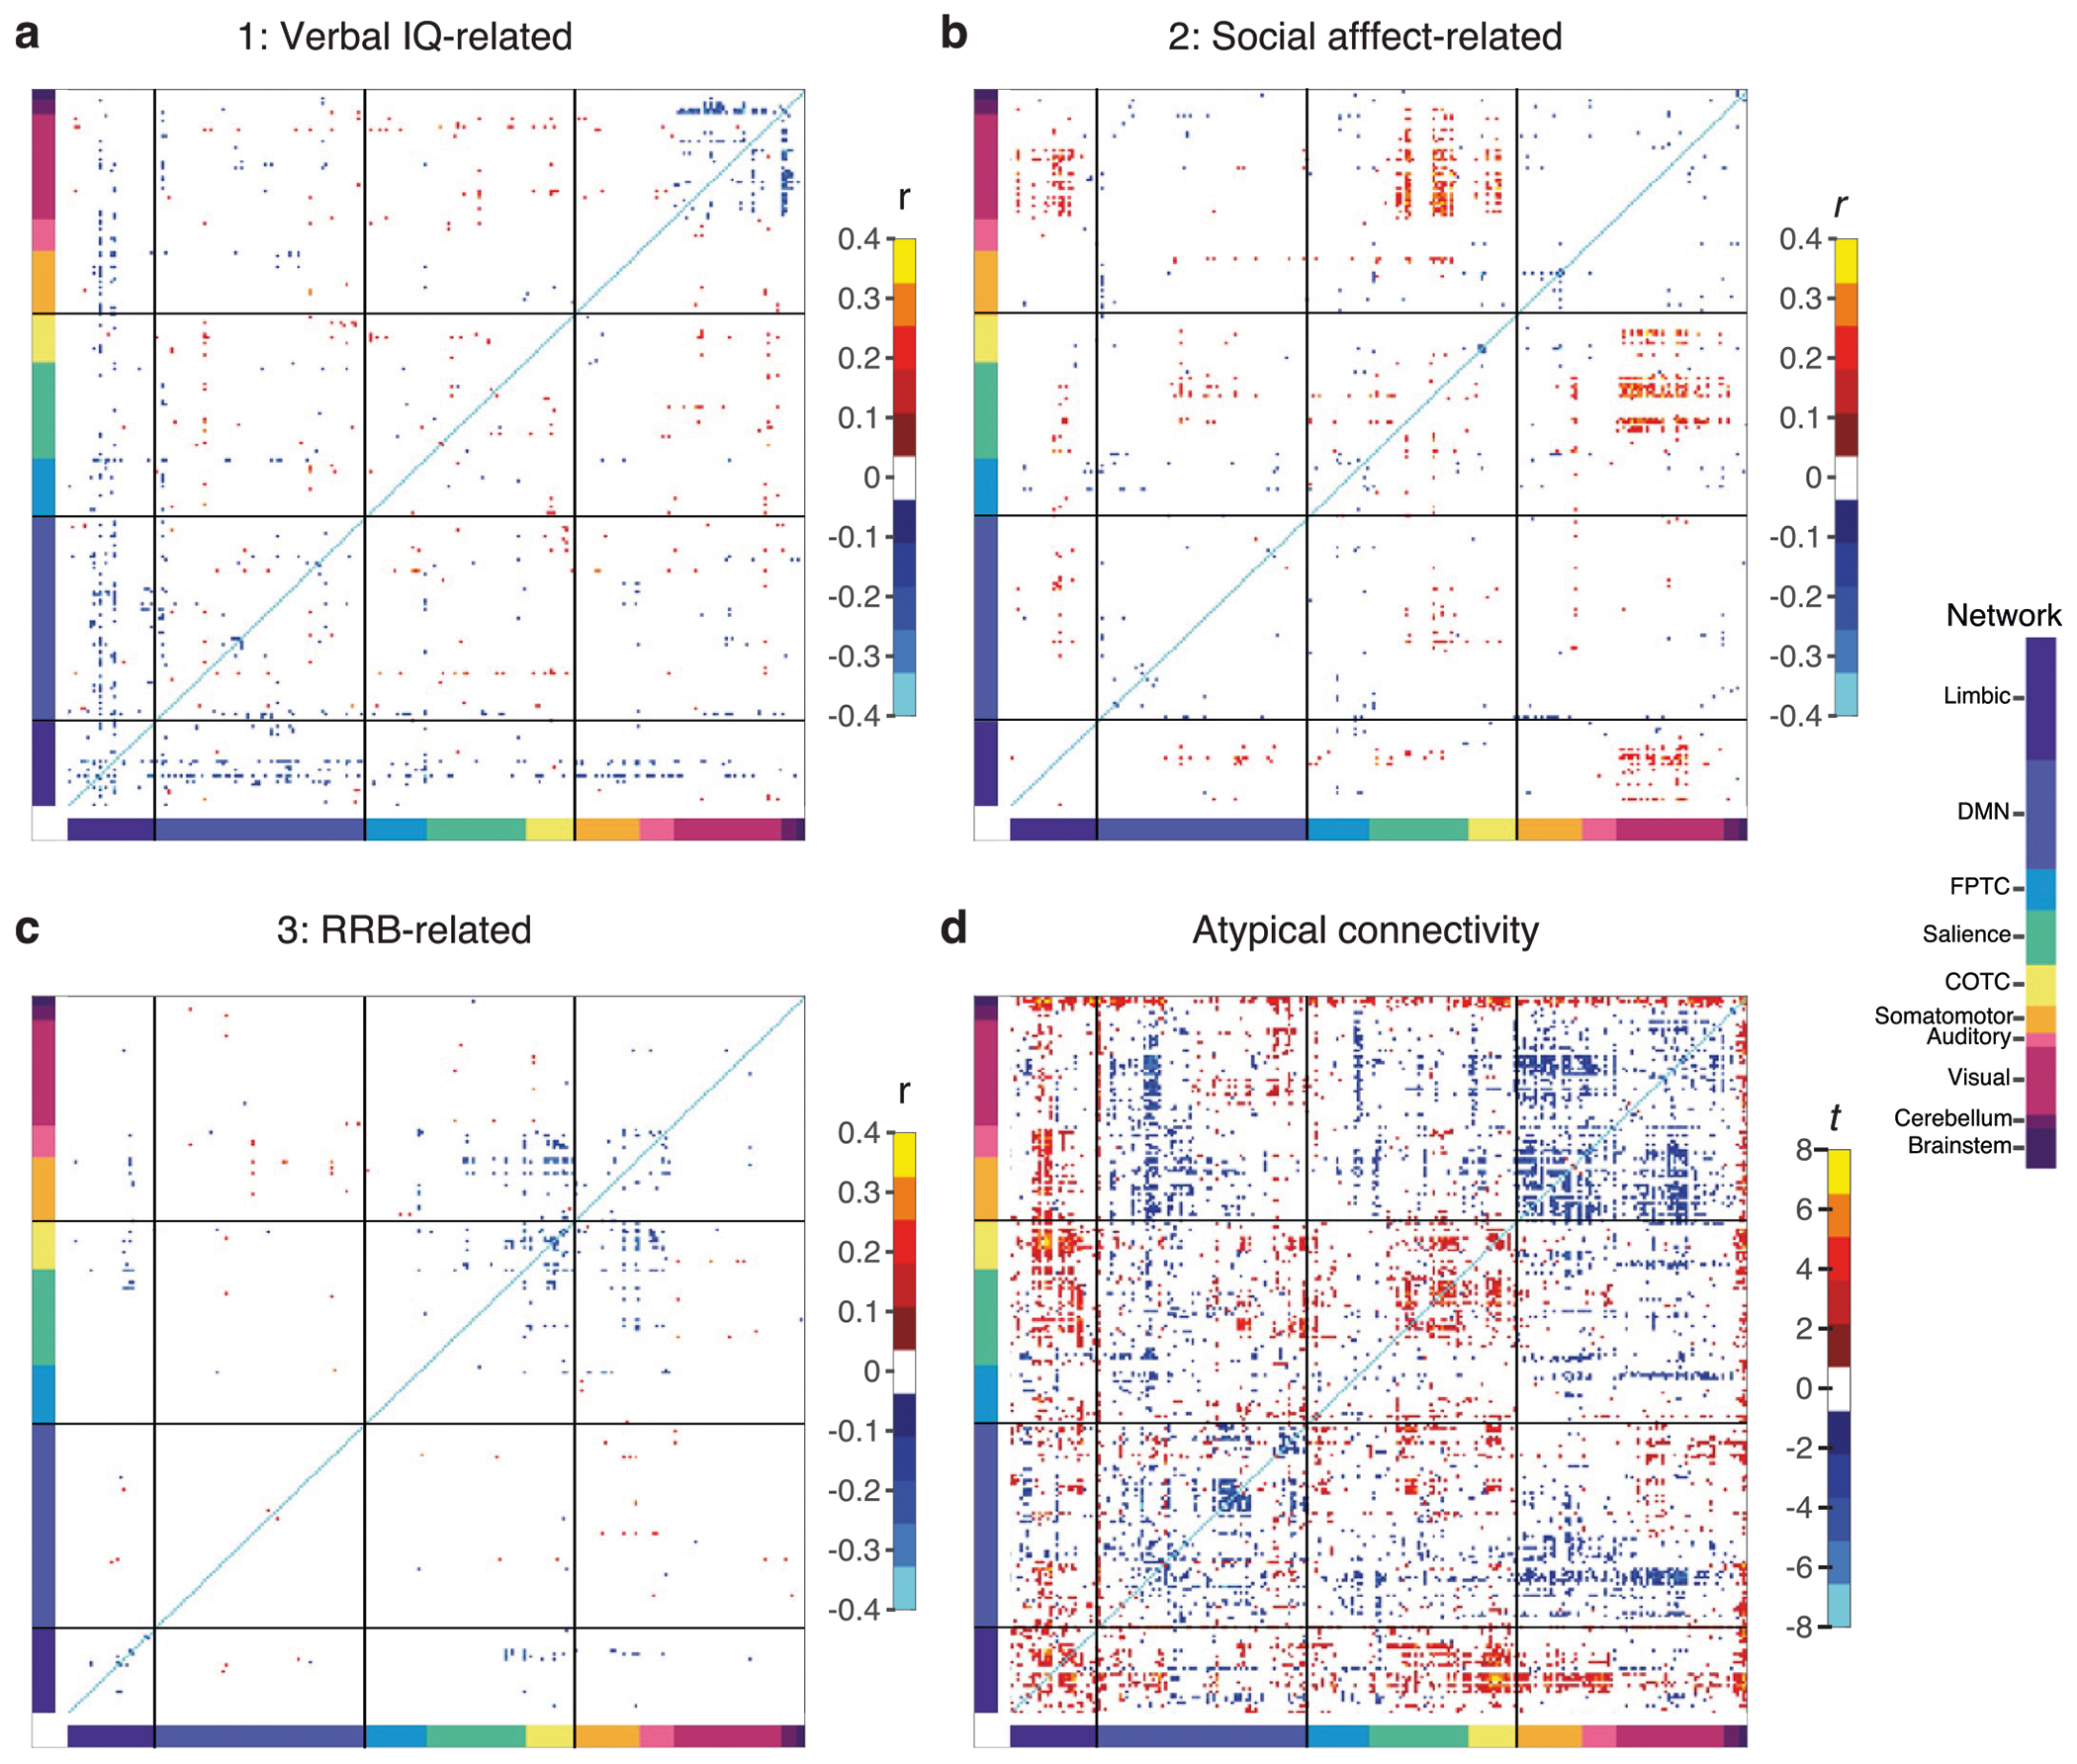
Extended Data Fig. 1 |. Connectivity score loadings on RSFC and atypical RSFC in 247 × 247 heatmaps.

Heatmaps of 247 × 247 regions of interest (ROIs) corresponding to panels in Fig. 2 sorted and labeled by functional network. (a) Correlation between verbal IQ-related dimension (dimension 1) and RSFC (FDR < 0.05; see Fig. 2a). (b) Correlation between social affect-related dimension (dimension 2) and RSFC (FDR < 0.05; see Fig. 2b). (c) Correlation between RRB-related dimension (dimension 3) and RSFC (FDR < 0.05; see Fig. 2c). (d) Atypical connectivity in ASD subjects versus controls (Welch’s t-test; FDR < 0.05; see Fig. 2d). Abbreviations described previously in Figs. 1–2.
