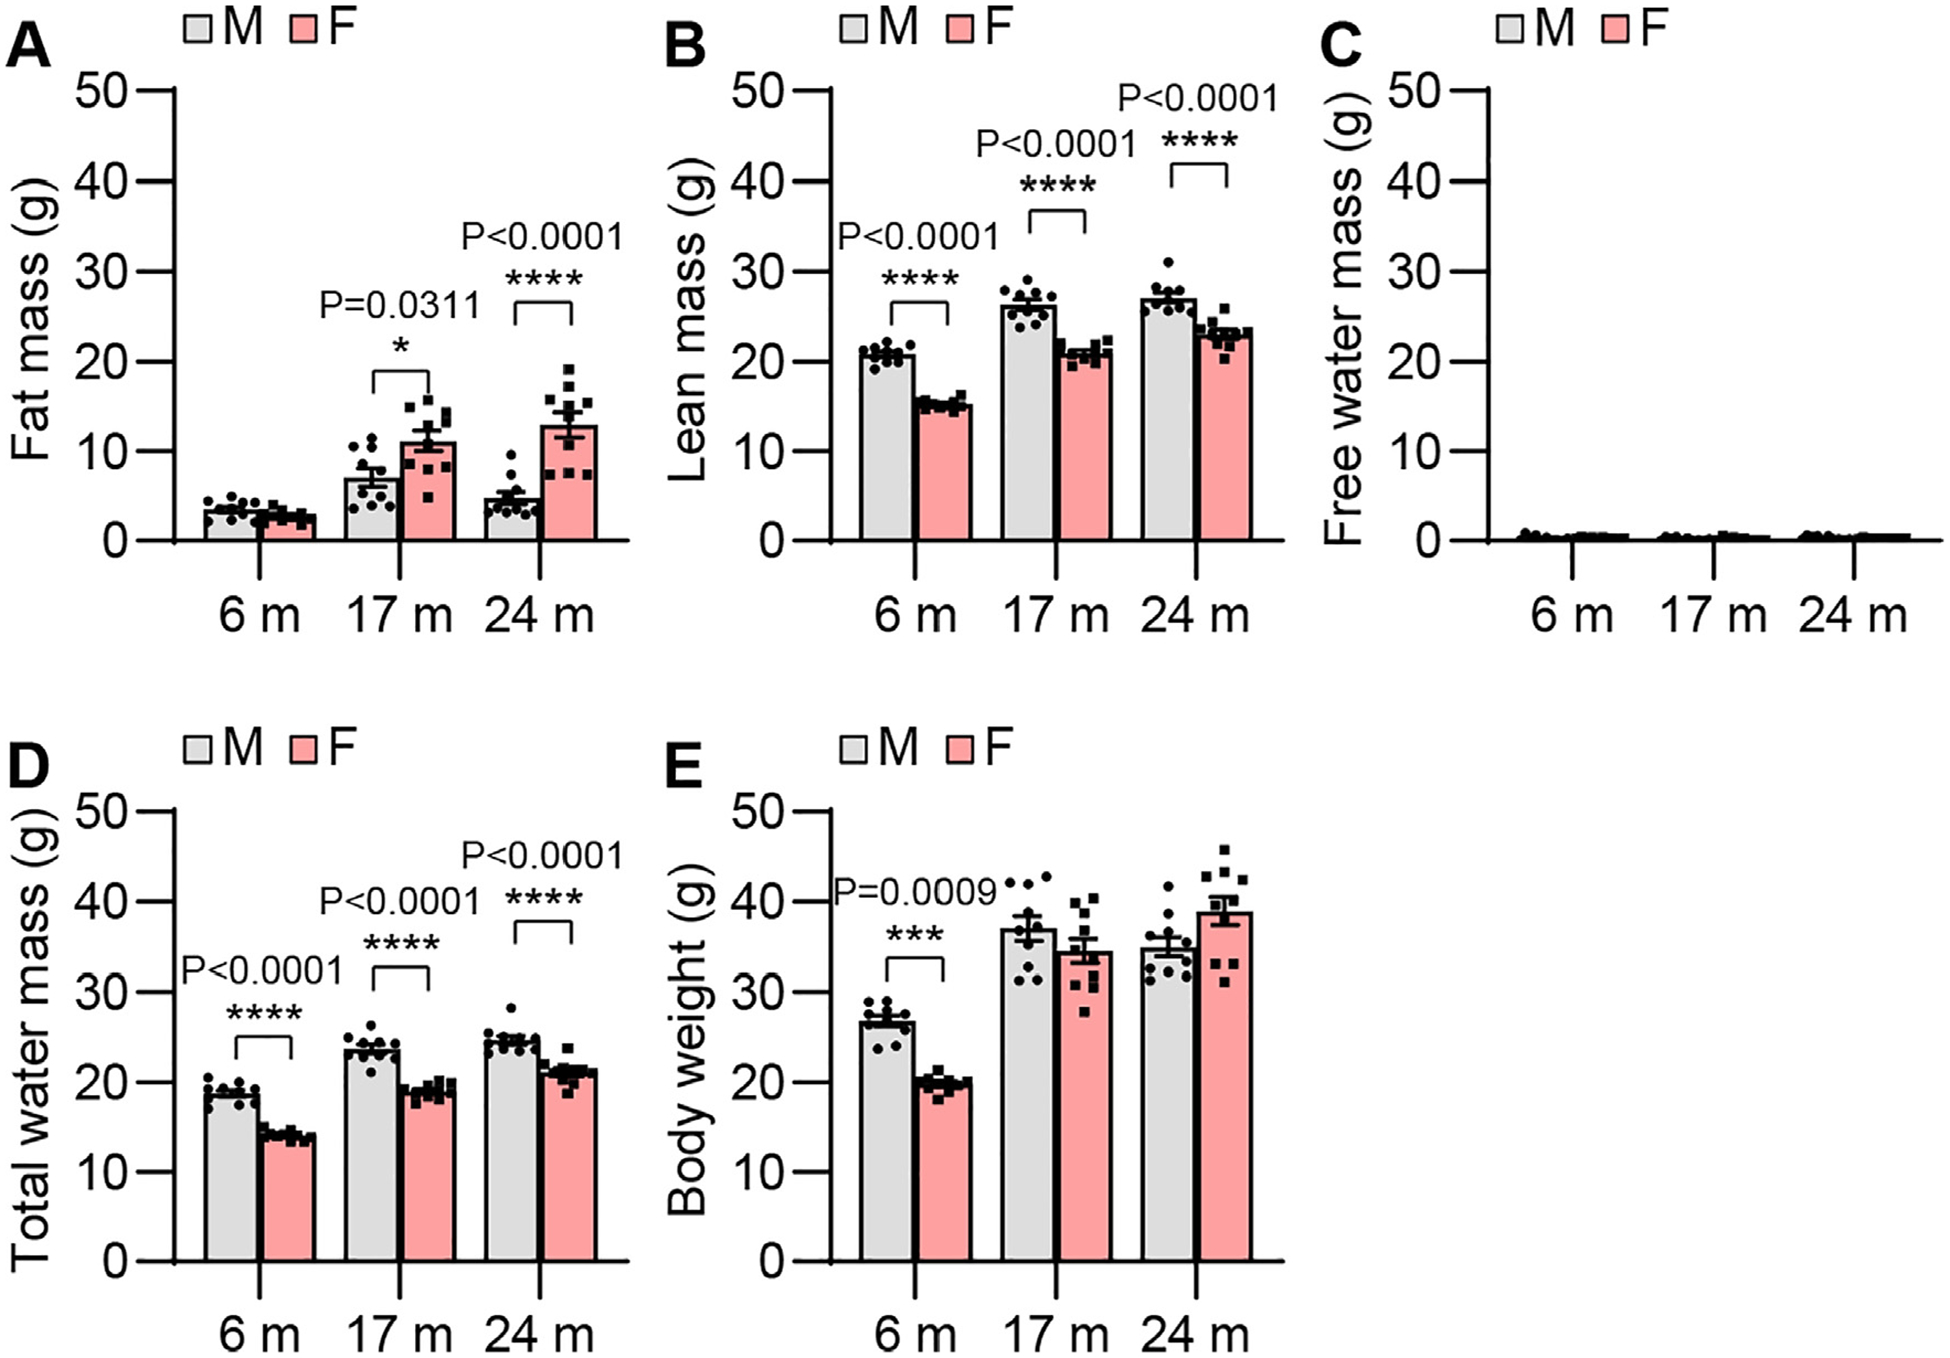
Fig. 3.

Body composition. Fat (A), lean (B), free water (C), and total water (D) masses and body weights (E) were measured in male and female CBA/CaJ mice at 6, 17, and 24 months of age; 6 m (20, 10 males and 10 females), 17 m (20, 10 males and 10 females), 24 m (20, 10 males and 10 females). Data are shown as means ± SEM. Two-way ANOVA with Bonferroni’s multiple comparisons test was performed: A Fat mass, Post hoc Bonferroni’s tests showed significant sex differences for 17 m (*, P < 0.05, P = 0.0311) and 24 m (****, P < 0.0001), sex effect (F = 27.87, DF = 1, P < 0.0001), age effect (F = 28.73, DF = 2, P < 0.0001), interaction (F = 12.39, DF = 2, P < 0.0001); B Lean mass, Post hoc Bonferroni’s tests showed significant sex differences for 6 m (****, P < 0.0001), 17 m (****, P < 0.0001), and 24 m (****, P < 0.0001), sex effect (F = 213.7, DF = 1, P < 0.0001), age effect (F = 157.1, DF = 2, P < 0.0001), interaction (F = 1.943, DF = 2, P = 0.1531); D Total water mass, Post hoc Bonferroni’s tests showed significant sex differences for 6 m (****, P < 0.0001), 17 m (****, P < 0.0001), and 24 m (****, P < 0.0001), sex effect (F = 201.4, DF = 1, P < 0.0001), age effect (F = 164.5, DF = 2, P < 0.0001), interaction (F = 1.501, DF = 2, P = 0.2320); E Body weight, Post hoc Bonferroni’s tests showed significant a sex difference for 6 m (***, P < 0.001, P = 0.0009), sex effect (F = 3.990, DF = 1, P = 0.0508), age effect (F = 87.77, DF = 2, F, female. P < 0.0001), interaction (F = 11.70, DF = 2, P < 0.0001). m, months of age; M, male; F, female.
