
Figure 3:
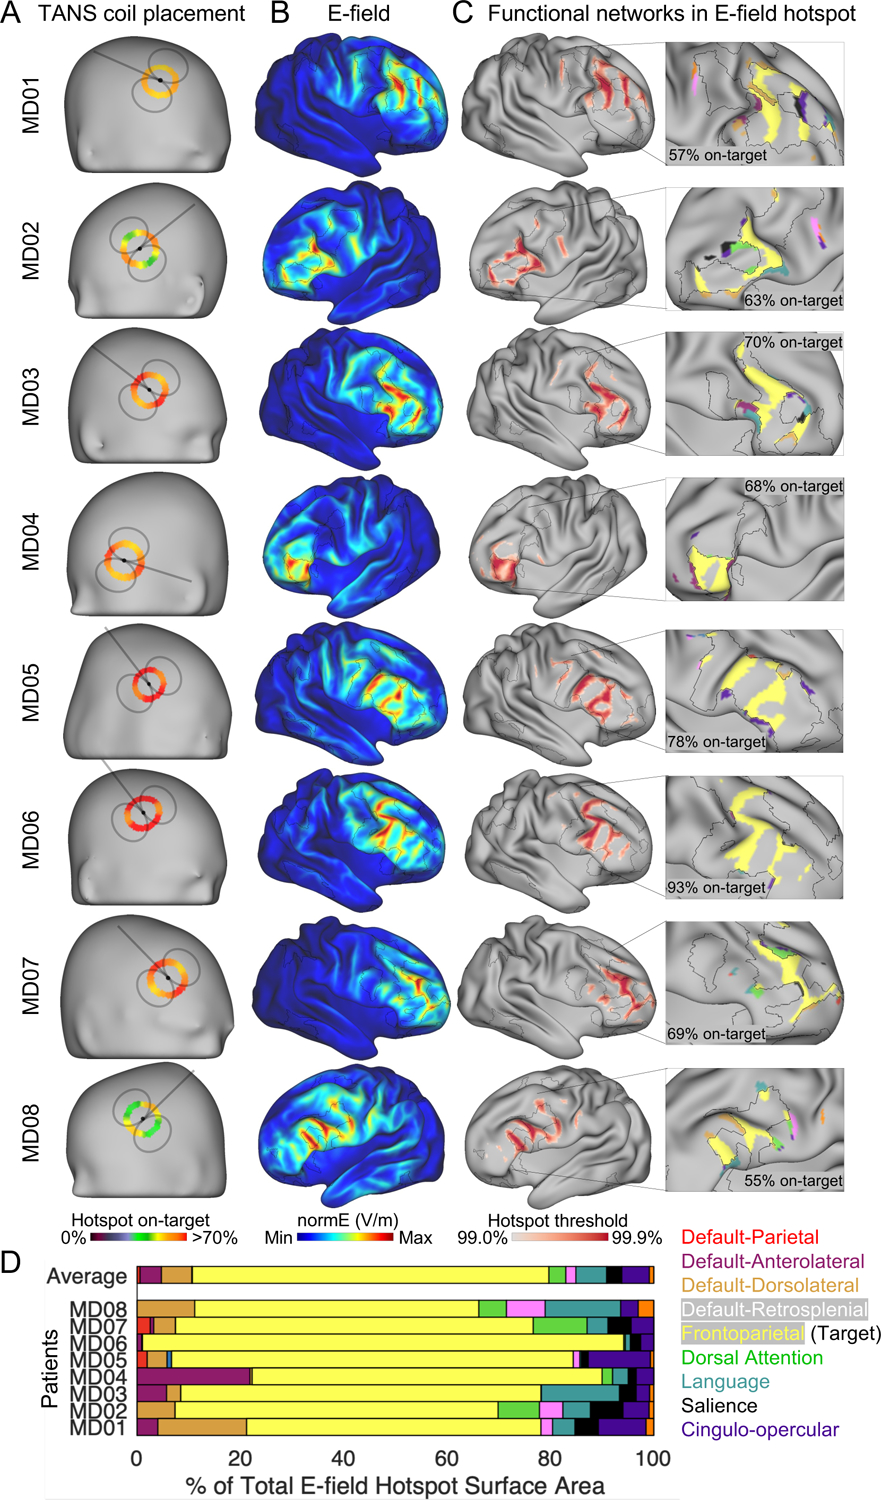
Selective stimulation of the frontoparietal network is achieved using TANS in silico in data from highly sampled patients with depression. (A) The coil placement that maximized the on-target value in each patient. The black foci represents the coil center. Circular heat maps show how the on-target value changes with coil orientation. (B) The electric field (E-field) generated by the optimal TMS coil placement. (C) The E-field hotspot defined using percentile based thresholds (99% to 99.9%, in 0.1% steps). The middle (99.5%) threshold is selected for visualizing functional networks inside the E-field hotspot in the inset. (D) Variability in functional network stimulation across patients summarized in a horizontal stacked bar graph. TANS = targeted functional network stimulation.