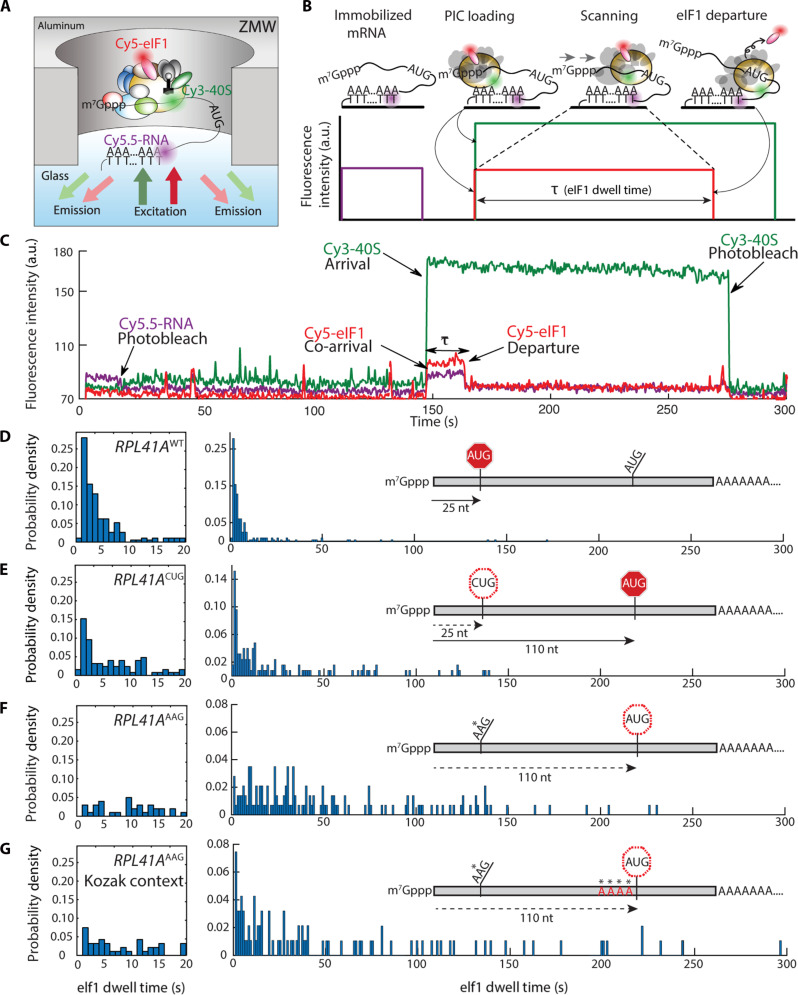
Fig. 1. Direct observation of scanning in real time.
(A) Experimental setup for single-molecule fluorescence scanning assays in zero-mode waveguides. (B) Idealized single-molecule fluorescence trace for scanning signal, indicating eIF1 dwell time, τ. (C) Representative trace with scanning signal observed on the wild-type RPL41A mRNA. (D to G) Representative eIF1 dwell-time distributions on wild-type RPL41A mRNA (n = 193 molecules), RPL41AAAG (n = 143), RPL41AAAG/Kozak (n = 94), and RPL41ACUG (n = 254) mRNAs, respectively. The distribution in the 0 to 20 s time domain is expanded to the left of the full-timescale distribution. Distributions from replicate experiments were statistically indistinguishable. Inset schematics indicate distances (in nucleotides) between the +1 nt and the initiation codon.

