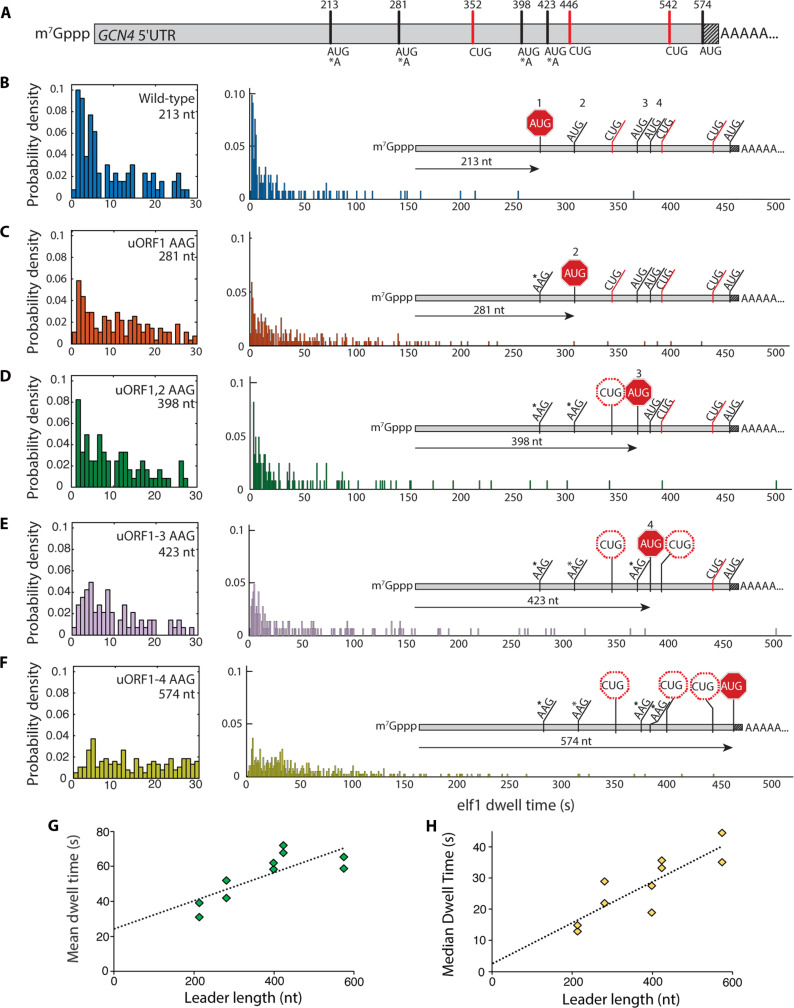
Fig. 2. Scanning dynamics on the GCN4 leader.
(A) Schematic of the GCN4 leader indicating positions of canonical upstream ORF AUG codons, near-cognate CUG triplets, and the GCN4 main-ORF AUG codon. The shaded portion indicates 30 nt of the GCN4 coding sequence included in the transcript. (B to F) eIF1 dwell-time distributions for the wild-type GCN4 leader sequence and the four sequential upstream ORF AUG-to-AAG variants. Left panels expand the short-time component of the distributions. Insets indicate relative linear distance traversed by the PIC for each leader sequence. For (B) to (F), the number of molecules in each distribution was 136, 115, 165, 98, and 160, respectively. (G and H) Mean and median eIF1 dwell times plotted against the cap to AUG leader length in nucleotides. Trend lines are from linear regression to all datapoints.

