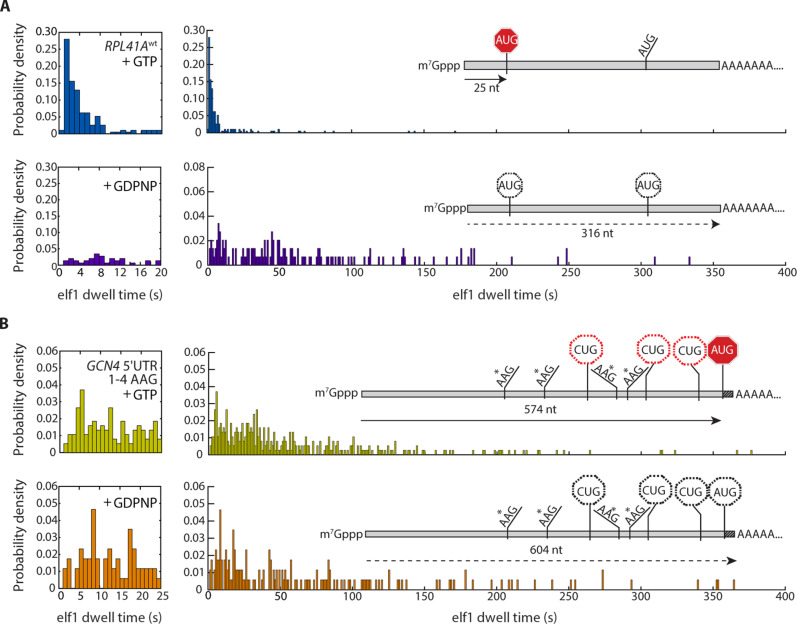
Fig. 3. Regulation of scanning by GTP hydrolysis.
(A and B) eIF1 dwell-time distributions for scanning on (A) RPL41Awt (n = 193 in the presence of GTP; n = 146 in the presence of GDPNP) and (B) the GCN4 quadruple uORF AUG-to-AAG variant (n = 378 in the presence of GTP; n = 172 in the presence of GDPNP), contrasted between PICs formed with GTP versus GDPNP in the eIF2 TC (top versus bottom panel, respectively).

