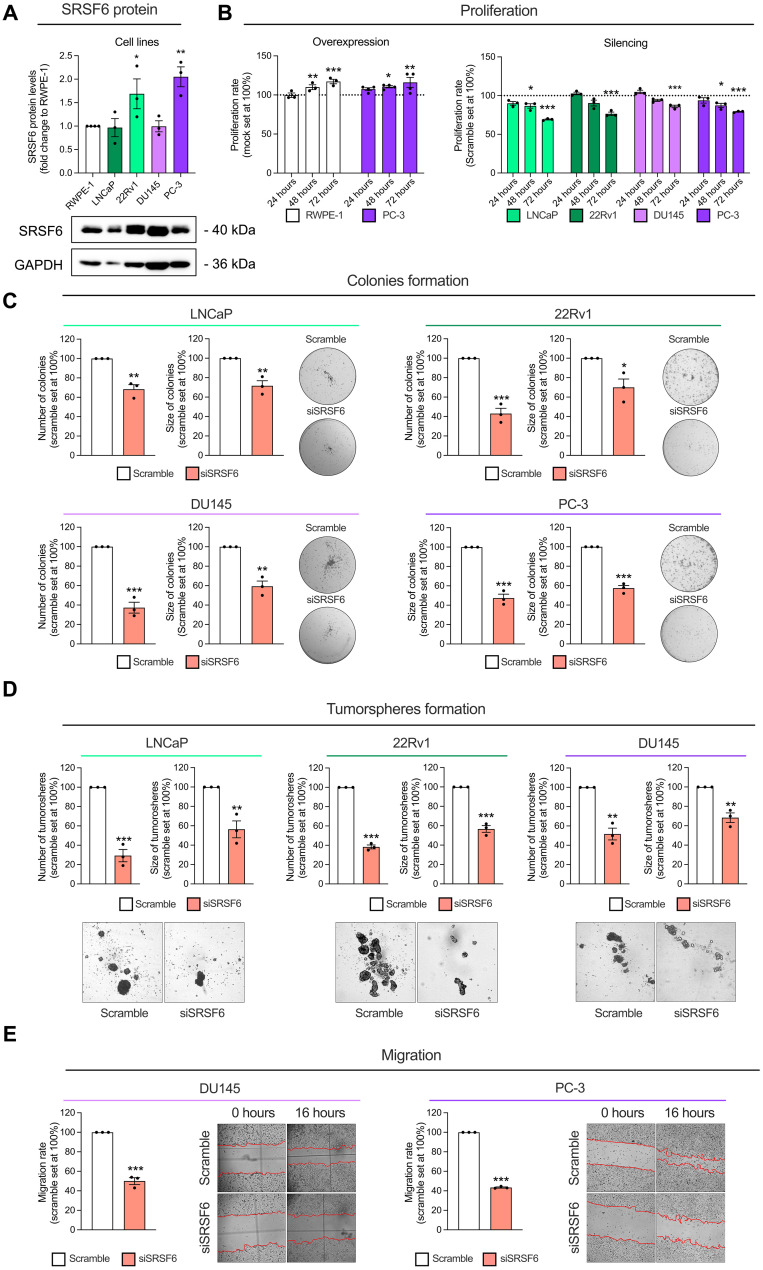
Fig. 4. Functional consequences in response to SRSF6 expression modulation in prostate-derived cell lines.
(A) Comparison of SRSF6 protein levels between a non-tumor prostate cell line (RWPE-1) and PCa cell lines LNCaP, 22Rv1, DU145, and PC-3 (n = 3). SRSF6 protein levels were determined by Western blot and adjusted by GAPDH. Data are represented as fold change of RWPE-1 cells (means ± SEM). Representative images of Western blot are depicted on the bottom panels. (B) Proliferation rate in response to SRSF6 overexpression in RWPE-1 and PC-3 cell lines (left), and in response to SRSF6 silencing in LNCaP, 22Rv1, DU145, and PC-3 cell lines (right) at 24, 48, and 72 hours determined by Resazurin assay. Data are represented as percentage to control cells (means ± SEM). (C) Number (left) and size (right) of colonies in response to SRSF6 siRNA in LNCaP (top left), 22Rv1 (top right), DU145 (bottom left), and PC-3 (bottom right). Images of representative wells are depicted. Data are represented as percentage to scramble cells (means ± SEM). (D) Number (left) and size (right) of tumorspheres in response to SRSF6 siRNA in LNCaP (left), 22Rv1 (center), and DU145 (right). Images of representative areas of wells are depicted. Data are represented as percentage to scramble cells (means ± SEM). (E) Migration rate in response to SRSF6 silencing after 16 hours of incubation in DU145 (left) and PC-3 (right) cell lines determined by wound-healing assay. Representative images are depicted. Data are represented as percentage to scramble cells (means ± SEM). Asterisks (*P < 0.05, **P < 0.01, and ***P < 0.001) indicate statistically significant differences between groups.

