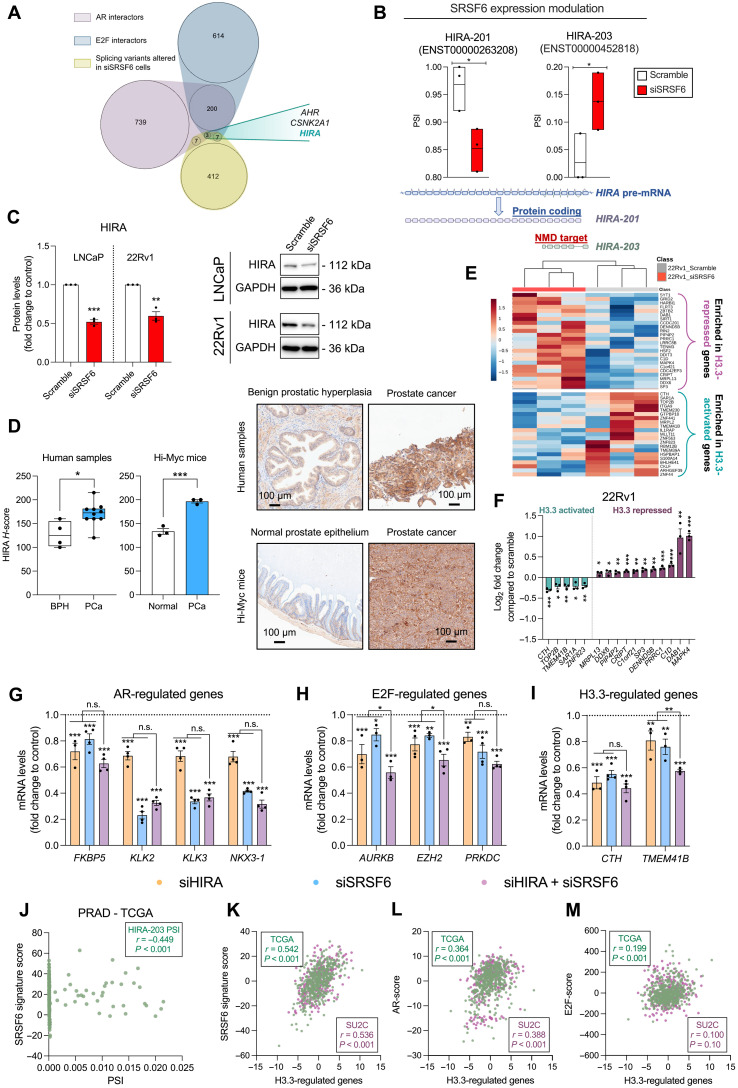
Fig. 7. Splicing alteration in response to the modulation of SRSF6 expression in PCa cells.
(A) Venn diagram depicting common AR and E2F interactors whose splicing pattern has been altered in response to SRSF6 silencing (siSRSF6). (B) Effect of SRSF6 silencing on the splicing of HIRA pre-mRNA (top). Representation of HIRA splicing event [alternative first exon (AF)] altered in response to SRSF6 silencing (bottom). (C) HIRA protein levels in response to SRSF6 silencing in LNCaP and 22Rv1 cells. Representative images are depicted on the right panel. (D) Comparison of HIRA protein levels by IHC between BPH (n = 4) and PCa (n = 10) samples (left) and between PCa (n = 3) and non-tumor prostate tissue (n = 3) samples from Hi-Myc mice (right). Data are expressed as min-to-max boxplot, with median of HIRA H-score. Representative images of human and mouse samples stained with HIRA antibody are depicted. (E) Heatmap of the expression of H3.3-regulated genes determined by RNA-seq in response to SRSF6 silencing in 22Rv1 cells. (F) Significantly altered H3.3-activated and H3.3-repressed genes in response to SRSF6 silencing in 22Rv1 cells. (G to I) Expression levels by qPCR of dysregulated AR- (G), E2F- (H), and H3.3-regulated genes (I) in response to HIRA and SRSF6 silencing in LNCaP cells. Data are represented as means ± SEM. n.s., not significant. (J) Correlation between HIRA-203 percent spliced-in (PSI) with SRSF6 signature score in prostate adenocarcinoma (PRAD)–TCGA cohort. (K to M) Correlation between the expression of H3.3-regulated genes and the transcriptionally inferred activity of SRSF6 (K), AR (L), and E2F (M) in the TCGA (green colored) and SU2C (purple colored) cohorts. Asterisks (*P < 0.05, **P < 0.01, and ***P < 0.001) indicate statistically significant differences between groups.

