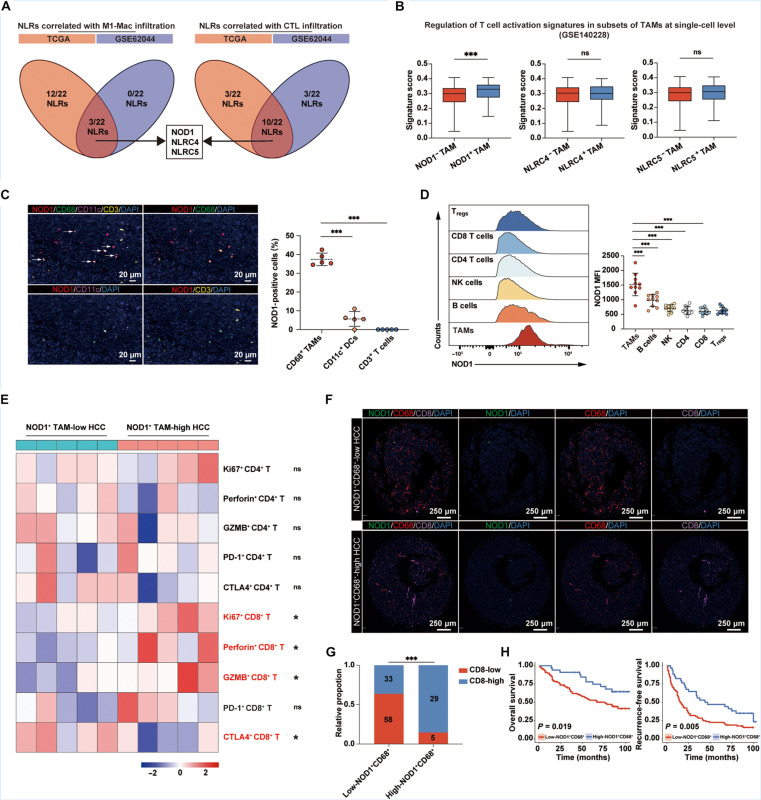
Fig. 1. The infiltration of NOD1+ TAM correlates with CD8+ T cell activation and improved survival in patients with HCC.
(A) Venn diagrams showing the overlap of statistically significant NLR members associated with M1-type macrophages and CTL infiltrations in both TCGA-LIHC and GSE62044 cohorts. (B) Single-cell analysis comparing expression-based scores for the regulation of T cell activation across different TAM subsets. (C) mIF analysis for NOD1, CD68, CD11c, and CD3 markers in human HCC tissues (n = 5). White arrows indicate NOD1+ TAMs. Scale bars, 20 μm. (D and E) Flow cytometric analysis of human HCC samples (n = 10). NOD1 expression across different immune cell populations within the HCC TME (D). Heatmap displaying relative expressions of functional molecules in CD4+ and CD8+ T cells in the low- and high-NOD1+ TAM groups (E). (F to H) mIF analysis in a cohort of patients with HCC with survival data (n = 125). Patients were categorized into low-NOD1+ CD68+ (n = 91) and high-NOD1+ CD68+ (n = 34) groups according to the optimal cutoff value determined by X-title software. Representative mIF images of NOD1, CD68, and CD8 were presented (F). Scale bars, 250 μm. The levels of CD8+ T cells among patients with HCC with low- or high-NOD1+ CD68+ cells (G). Kaplan-Meier analysis comparing the OS [(H), left] and RFS [(H), right)] of patients with HCC with low or high levels of NOD1+CD68+ cells. Statistical analysis was performed using the Mann-Whitney U test in (B), the Student’s t test in [(C) and (D)], the chi-square test in (G), and the log-rank test in (H). *P < 0.05, **P < 0.01, and ***P < 0.001. Data were presented as median with interquartile range (IQR) in (B) and mean with SD in (D). NK, natural killer.

