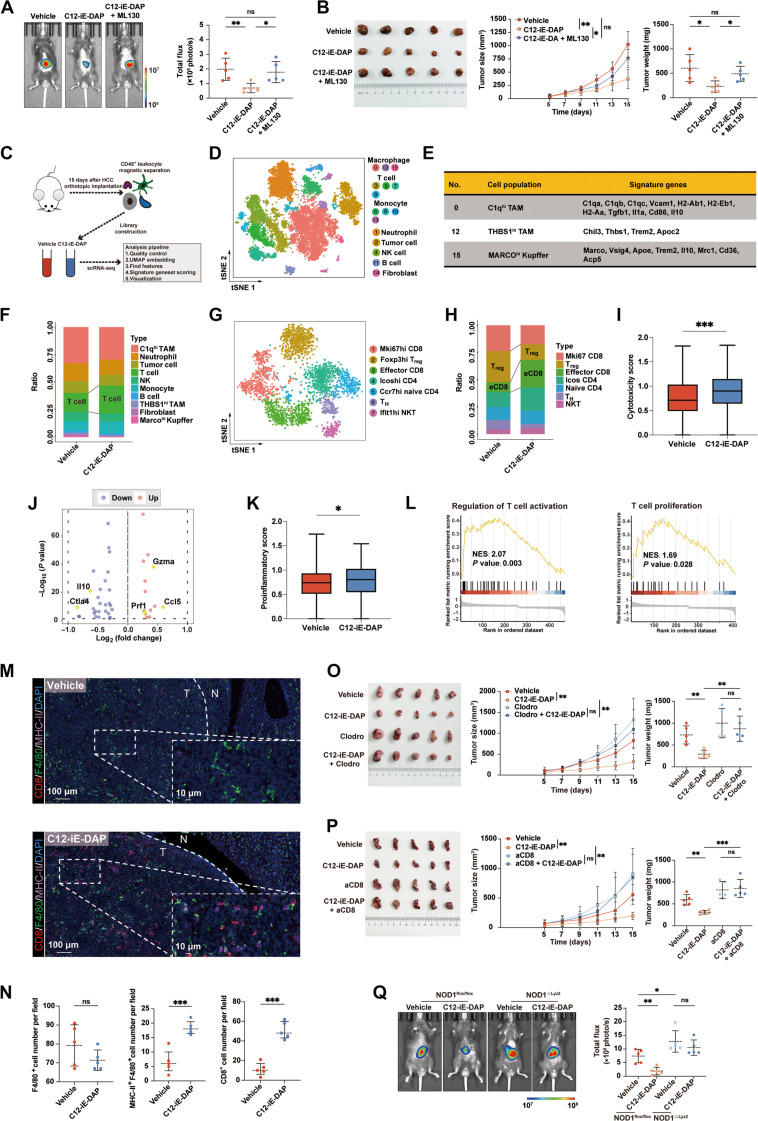
Fig. 3. In vivo activation of macrophage NOD1 delays HCC progression by enhancing CD8+ T cell immunity.
(A and B) Orthotopic and subcutaneous HCC tumors treated with either C12-iE-DAP, C12-iE-DAP + ML130, or vehicle (n = 5 each). (C) Schematic of the scRNA-seq experiment design. (D) t-Distributed stochastic neighbor embedding (tSNE) plot clustering with cell annotation for CD45+ cells. (E) Signature genes of identified clusters of macrophages. (F) Proportions of different immune cell types. (G) tSNE plot clustering with cell annotation for T cells. (H) Proportions of different T cell types. (I) The cytotoxicity score in CD8+ T cells between two groups. (J) Volcano plot showing differentially expressed genes between CD8+ T cells in the vehicle or C12-iE-DAP–treated HCC. (K) The proinflammatory score in NOD1+ C1qhi TAMs between two groups. (L) Gene set enrichment analysis (GSEA) analysis. (M and N) mIF analysis for CD8, F4/80, and MHC-II markers in the vehicle- or C12-iE-DAP–treated orthotopic HCC tumors. (O and P) Subcutaneous HCC tumors treated with either vehicle or C12-iE-DAP in macrophage-depleted (O) or CD8-depleted (P) mice (n = 5, each). (Q) Orthotopic HCC tumors growing in NOD1flox/flox versus NOD1△Lyz2 mice treated with either vehicle or C12-iE-DAP (n = 5 each). Statistical analysis was performed using the Student’s t test [or the Mann-Whitney U test in (I) and (K)]. Data were presented as mean with SD [or median with IQR in (I) and (K)]. *P < 0.05, **P < 0.01, and ***P < 0.001. UMAP, Uniform Manifold Approximation and Projection; TH, T helper; NES, normalized enrichment score.

