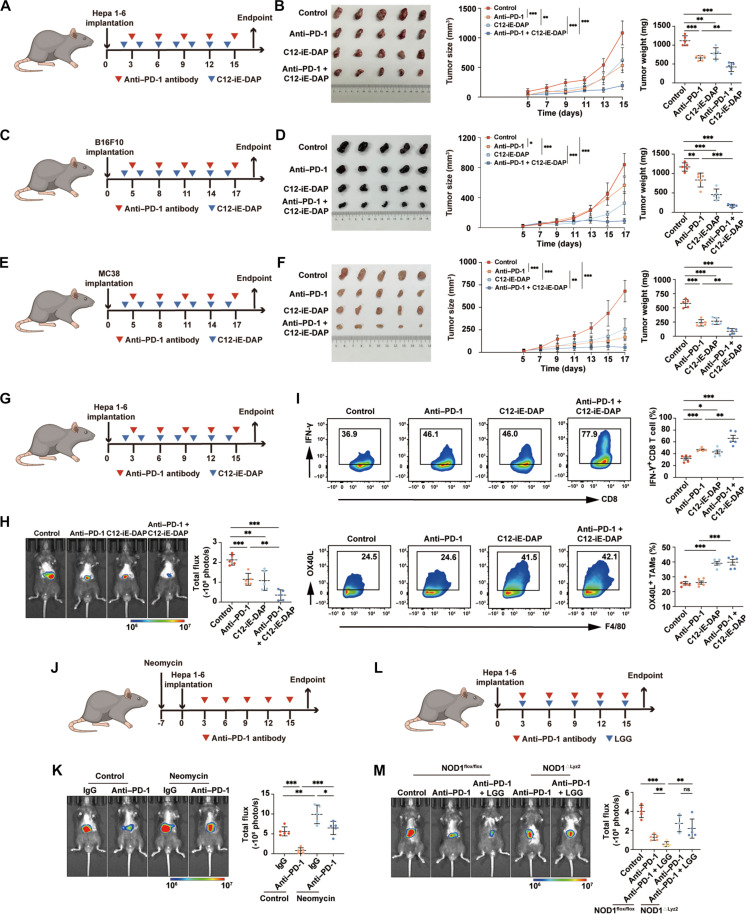
Fig. 6. Activation of NOD1 enhances the therapeutic efficacy of anti–PD-1 treatment.
(A and B) Subcutaneous Hepa 1-6 tumors in C57BL/6 mice treated intraperitoneally with either anti–PD-1, C12-iE-DAP, anti–PD-1 + C12-iE-DAP, or isotype control (n = 5 each). Tumor growth curves and tumor weights are shown. (C and D) Subcutaneous B16F10 tumors in C57BL/6 mice treated intraperitoneally with either anti–PD-1, C12-iE-DAP, anti–PD-1 + C12-iE-DAP, or isotype control (n = 5 each). Tumor growth curves and tumor weights are shown. (E and F) Subcutaneous MC38 tumors in C57BL/6 mice treated intraperitoneally with either anti–PD-1, C12-iE-DAP, anti–PD-1 + C12-iE-DAP, or isotype control (n = 5 each). Tumor growth curves and tumor weights are shown. (G and H) Orthotopic Hepa 1-6 tumors in C57BL/6 mice treated intraperitoneally with either anti–PD-1, C12-iE-DAP, anti–PD-1 + C12-iE-DAP, or isotype control (n = 5 each). (I) Flow cytometry analysis of IFN-γ+ CD8+ T cells and OX40L+ TAMs in orthotopic Hepa 1-6 tumors (n = 5 each). (J and K) Orthotopic Hepa 1-6 tumors growing in neomycin-treated mice or untreated mice, followed by treatment of anti–PD-1 antibodies (n = 5 each). (L and M) Orthotopic HCC tumors growing in NOD1flox/flox or NOD1△Lyz2 mice and treated with either anti–PD-1, anti–PD-1 + LGG, or isotype control (n = 5 each). Statistical analysis was performed using the Student’s t test. Data were presented as mean with SD. *P < 0.05, **P < 0.01, and ***P < 0.001. LGG, Lactobacillus rhamnosus GG.

