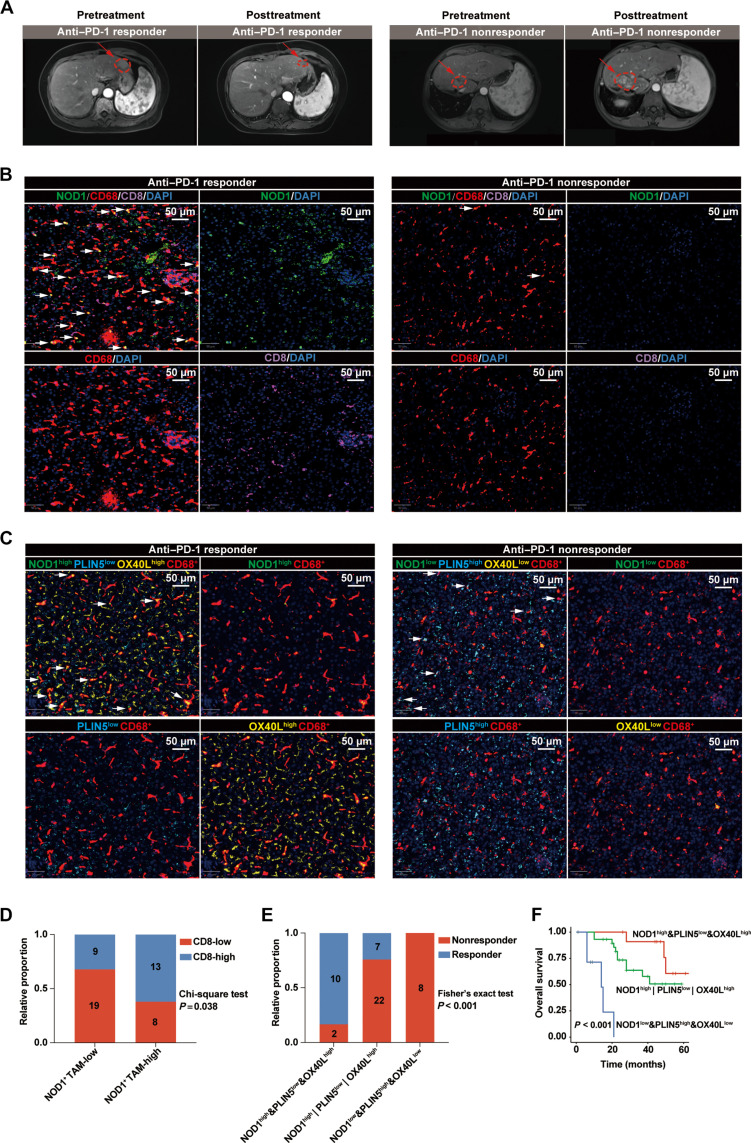
Fig. 7. Activated NOD1/PLIN5/OX40L axis within TAMs is positively correlated with improved clinical outcomes in patients with HCC receiving anti–PD-1 treatments.
(A) Representative magnetic resonance imaging depicting patients with HCC classified as either responders (n = 17) or nonresponders (n = 32) to anti–PD-1 treatment. (B) The representative mIF images of NOD1, CD68, and CD8 markers in tumor tissues from patients with HCC who either responded or did not respond to anti–PD-1 treatment. White arrows indicate NOD1+ TAMs. Scale bars, 50 μm. (C) The representative mIF images of NOD1, PLIN5, OX40L, and CD68 markers in tumor tissues from patients with HCC who either responded or did not respond to anti–PD-1 treatment. White arrows indicate NOD1highPLIN5lowOX40Lhigh TAMs (left) or NOD1lowPLIN5highOX40Llow TAMs (right). Scale bars, 50 μm. (D) The levels of CD8+ T cells among anti–PD-1–treated patients with HCC with low- (n = 28) or high- (n = 21) NOD1+ CD68+ cells. (E) The distributions of treatment responses among anti–PD-1–treated patients with HCC exhibited either NOD1high&PLIN5low&OX40Lhigh (n = 12), NOD1low&PLIN5high&OX40Llow (n = 8), or others (n = 29). (F) Kaplan-Meier analysis comparing the OS of anti–PD-1–treated patients with HCC exhibited either NOD1high&PLIN5low&OX40Lhigh, NOD1low&PLIN5high&OX40Llow, or others. Statistical analysis was performed using the chi-square test in (D), the Fisher’s exact test in (E), and the log-rank test in (F).

