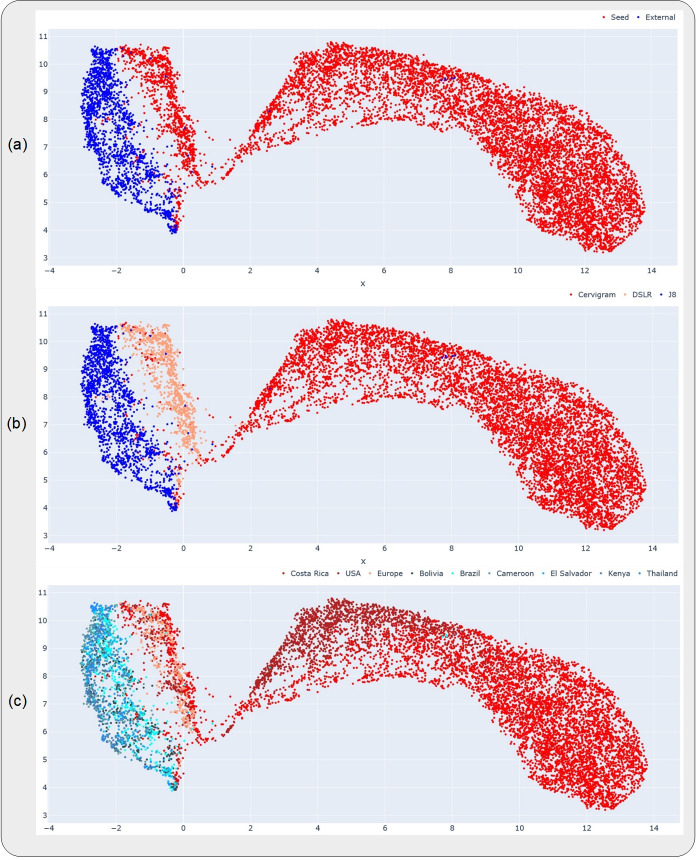
Fig 1. Uniform manifold approximation and projections (UMAP) highlighting the relative distributions of the datasets, devices and geographies investigated in this work.
Each subplot highlights a different representation of the UMAP, where the color coding (highlighted in the corresponding legend at the top of each subplot) is at the (a) dataset-level, (b) device-level and (c) geography-level. The datasets and devices occupy distinct clusters in (a) and (b), while the geographies are all clustered together within the same device in (c). The x- and y-axes are in arbitrary units, representing the two UMAP components on which the higher dimensional data was projected.

