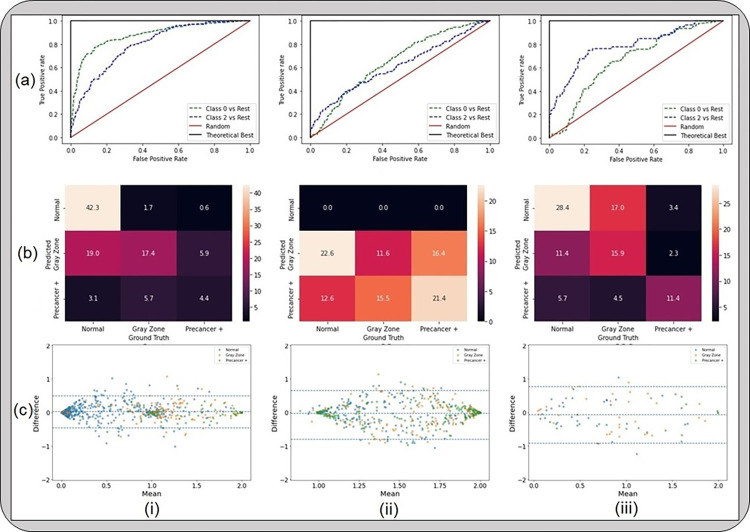
Fig 3. Results from the first set of the generalizability analyses, highlighting that device level heterogeneity impacts our model performance greater than geography level heterogeneity.
The classification performance and repeatability plots depicted here include (a) receiver operating characteristics (ROC) curves; (b) confusion matrices; and (c) Bland-Altman plots, for models that were (i) trained on “SEED” and tested on a held-aside set from “SEED”; (ii) trained on “SEED” and tested on “EXT”; and (iii) trained on a dataset comprising of “SEED” + all images from “EXT” except Bolivia and tested on Bolivia images from “EXT”. “Gray Zone” = “Indeterminate”.

