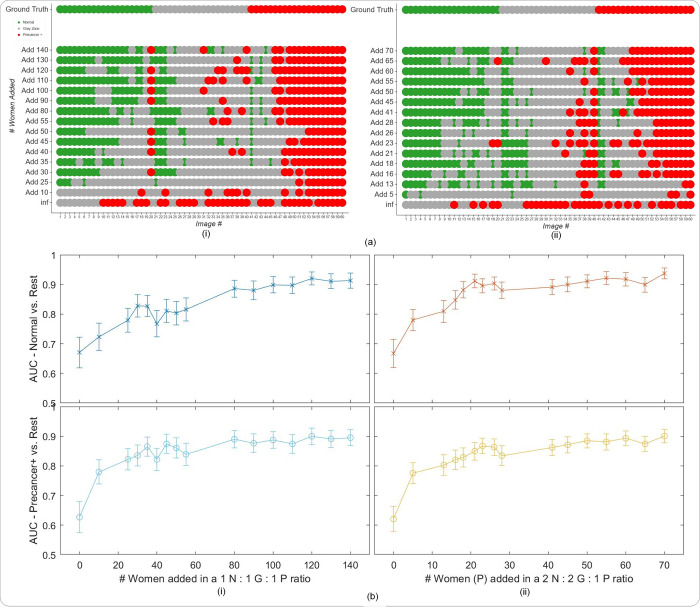
Fig 4. Results from the second set of generalizability analysis, highlighting that retraining can improve performance on a new device previously not present in the “SEED”.
(a) Model level comparison across models representing incremental additions of “EXT” (J8) images at the woman level to the training set of “SEED” images, with the “EXT” images added in (i) a 1n normal (N): 1n indeterminate (I): 1n precancer+ (P) ratio; and (ii) a 2n N: 2n I: 1n P ratio of ground truth classes at the woman level, where n = # of precancer+ women added (y-axes) (b) Plots of area under receiver operating characteristics curve (AUC) vs. # women added to the training set per ground truth class, in the same ratios as in (a). For example, in (ii), the x-axis represents the # precancer+ (P) women added (n) in the ratio 2n N: 2n I: 1n P to the training set. The top row plots the Normal (class 0) vs. Rest AUC, while the bottom row plots the Precancer+ (class 2) vs. rest AUC, respectively, on the y-axis. In panel (a) “normal” = green, “indeterminate” / “gray zone” = gray and “precancer+” = red.

