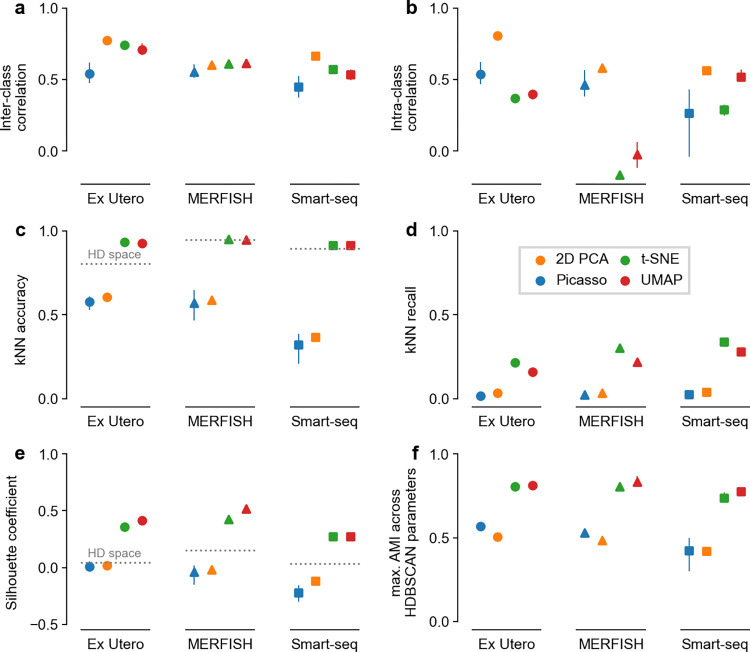
Fig 2. Embedding quality metrics.
Panels correspond to metrics, colors correspond to embedding methods, marker shapes correspond to datasets. Averages over five runs, error bars go from the minimum to the maximum across runs. Dotted horizontal lines show the values of the metrics in the high-dimensional gene space. a–b: The two metrics from Chari and Pachter [5], reproducing the results from their Fig 7C–7D: kNN accuracy and kNN recall (k = 10). e: Silhouette coefficient. f: Maximum adjusted mutual information between classes and 2D clusters obtained with HDBSCAN using a range of hyperparameter values.

