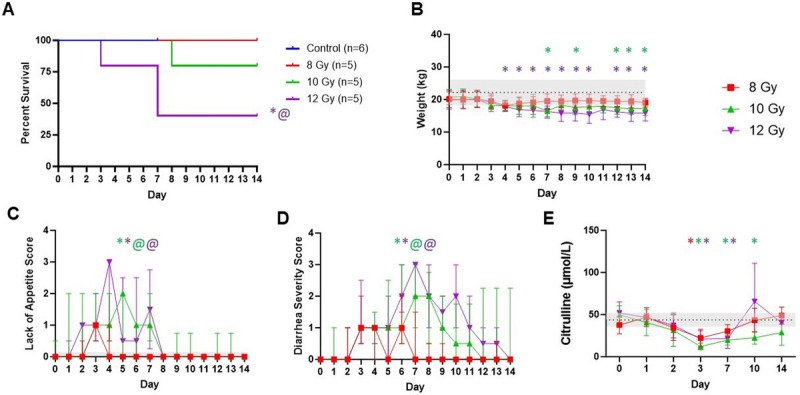
Fig. 1.

Impact of radiation dose on clinical outcomes. Longitudinal endpoints are shown as (A) survival, (B) weight, (C) loss of appetite, (D) diarrhea severity, and (E) LC-MS analysis for L-citrulline concentration in plasma over time. Control (n = 6), 8 Gy (n = 5), 10 Gy (n = 5), and 12 Gy (n = 5). Values for weight are represented as control mean ± SD. Loss of appetite and diarrhea severity are depicted as median and interquartile ranges. Statistical significance is indicated by text, color, and symbol. * Significant difference between control and radiation dose group. @ Significant difference between 8 Gy and another radiation dose group. The color of each symbol represents the dose group.
