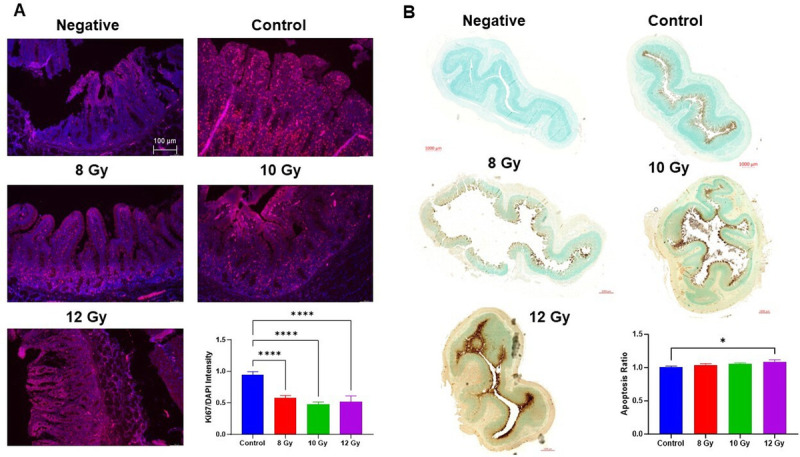
Fig. 3.

Immunohistochemistry of cell turnover. Stains depict negative controls, control, 8–12 Gy irradiated jejunum (A) Immunofluorescence with DAPI (blue) and Ki67 (red). Representative 10× images taken with Leica microscope, scale at 100 μm. (B) TUNEL stain using DAB to generate a brown color at the site of DNA fragmentation while methyl green was the counterstain for normal cells. Representative images from Zeiss AxioScan at 20x with scale bars of 1 mm. Barplots show quantified Ki67 and TUNEL positive ratio. Bars represent mean ± SD. *P < 0.05 and **** P < 0.0001 (one-way ANOVA, Tukey’s posttesting).
