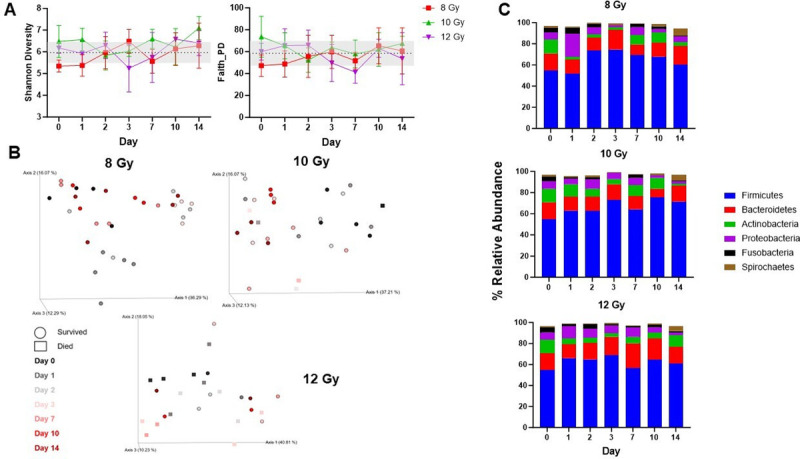
Fig. 6.

Effects of radiation on the gut microbiota. (A) Shannon and Faith’s Phylogenetic alpha diversity. Values are represented as mean ± SD. (B) Generalized UniFrac analysis evaluating microbial community composition at each irradiation dose over time. Each axis of the PCoA plot explains the variance in the data. Each dot (survivors) or square (decedents) is an individual sample and time points are color-coded. (C) Phyla level taxonomic classification showing mean relative abundance across time in each dose group. Phyla consisting of >1% of total bacterial composition are depicted.
