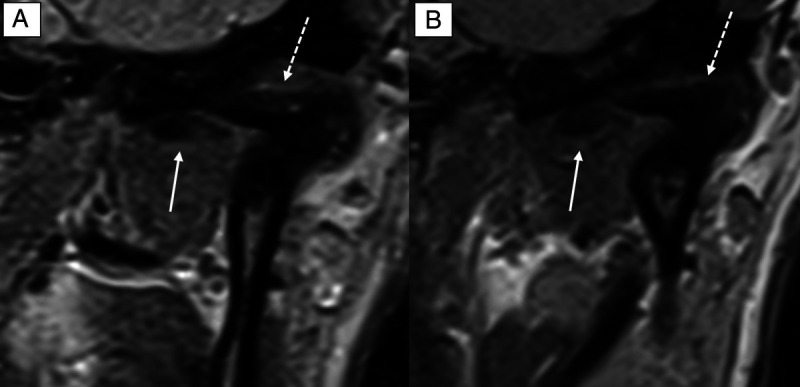
FIGURE 3.

Comparison of the image quality (IQ) in a coronal proton density-weighted sequence of the same patient at 0.55 T (A) and 1.5 T (B). The IQ is sufficient in both examinations with medial disc dislocation (white arrow) and degenerative sclerotic changes (white dotted arrow) of the temporomandibular joint. On a 4-point Likert scale (LS), the 0.55 T IQ scored 3, whereas the 1.5 T IQ scored 4 owing to the smaller acquired voxel size at 1.5 T.
