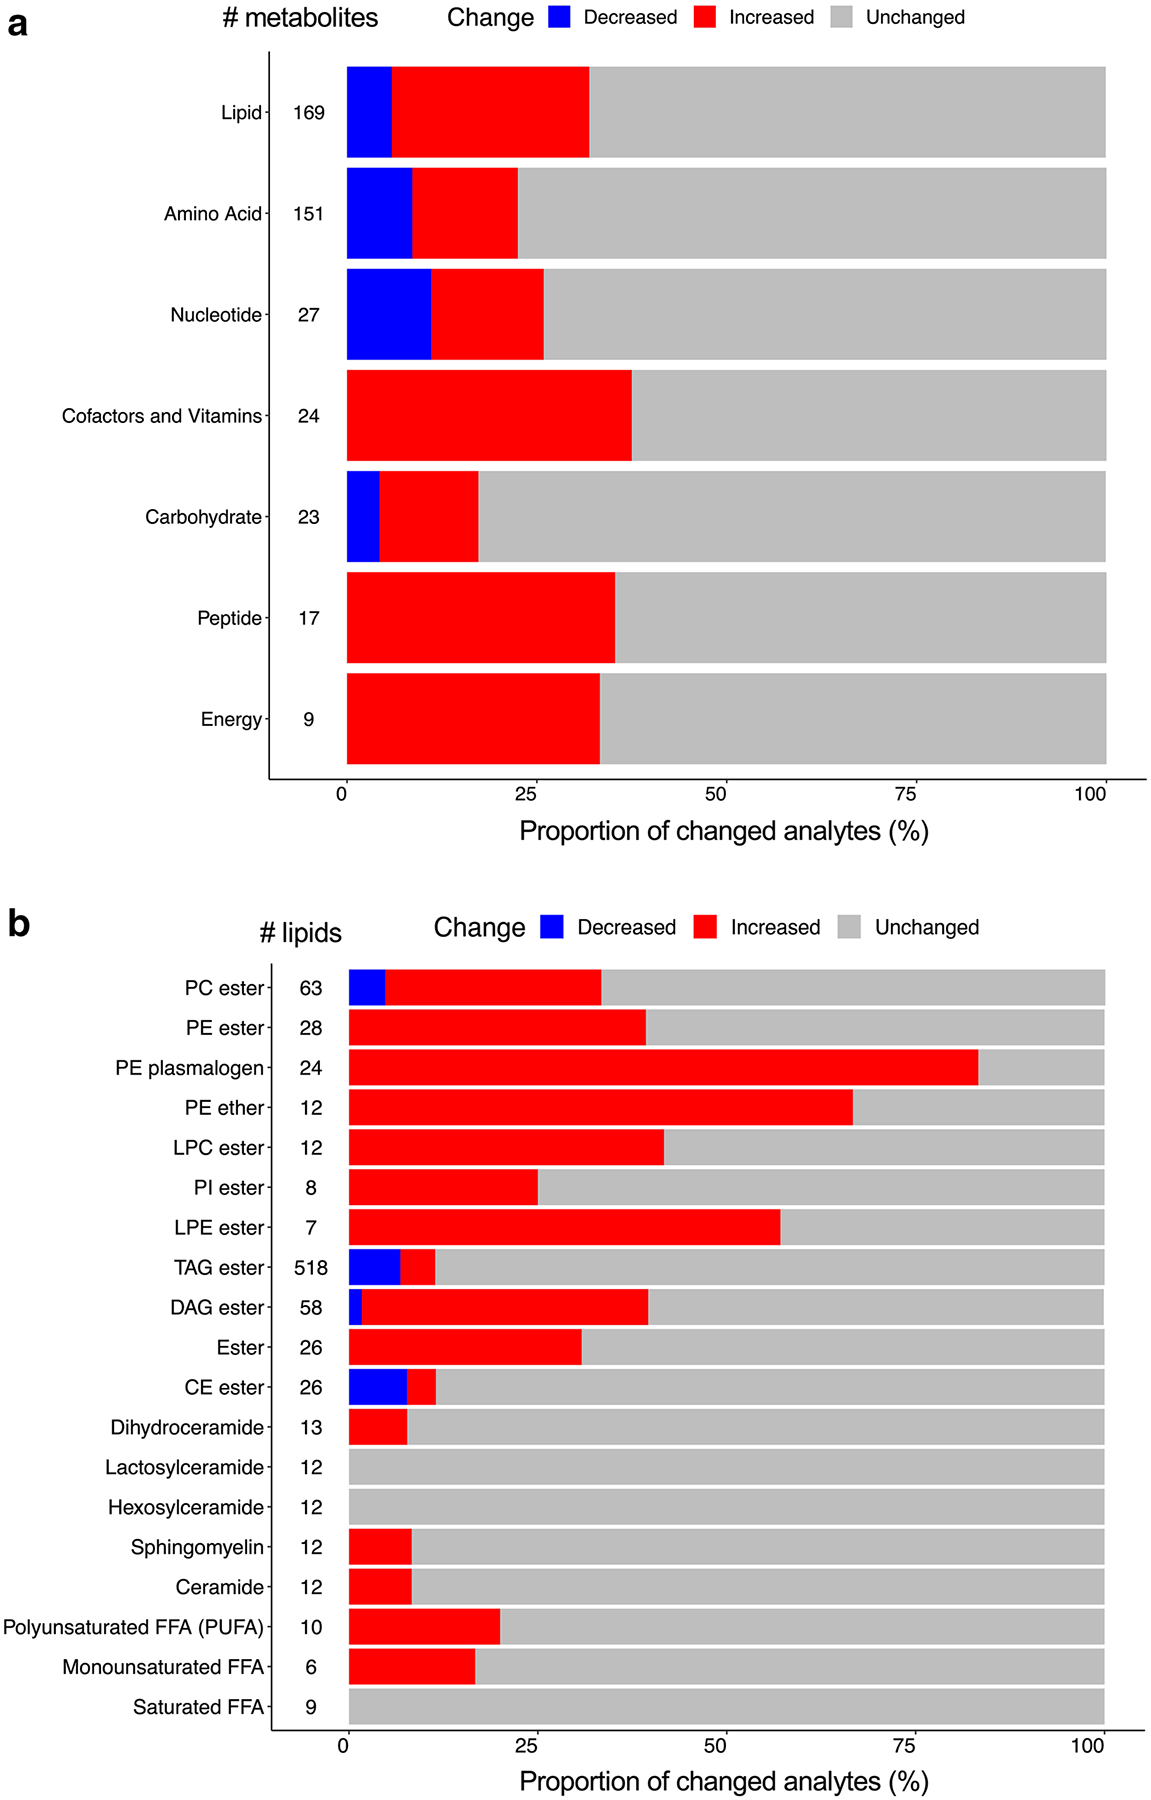
Fig. 3.

Proportion of classes of altered metabolites and complex lipids. a, b Bar plots showing the percentage of altered metabolites and lipids in each class. a Global metabolomics platform. (b) Lipidomics platform. Blue: decreased; red: increased; gray: unchanged. #: total numbers of metabolites and lipids identified in the class
