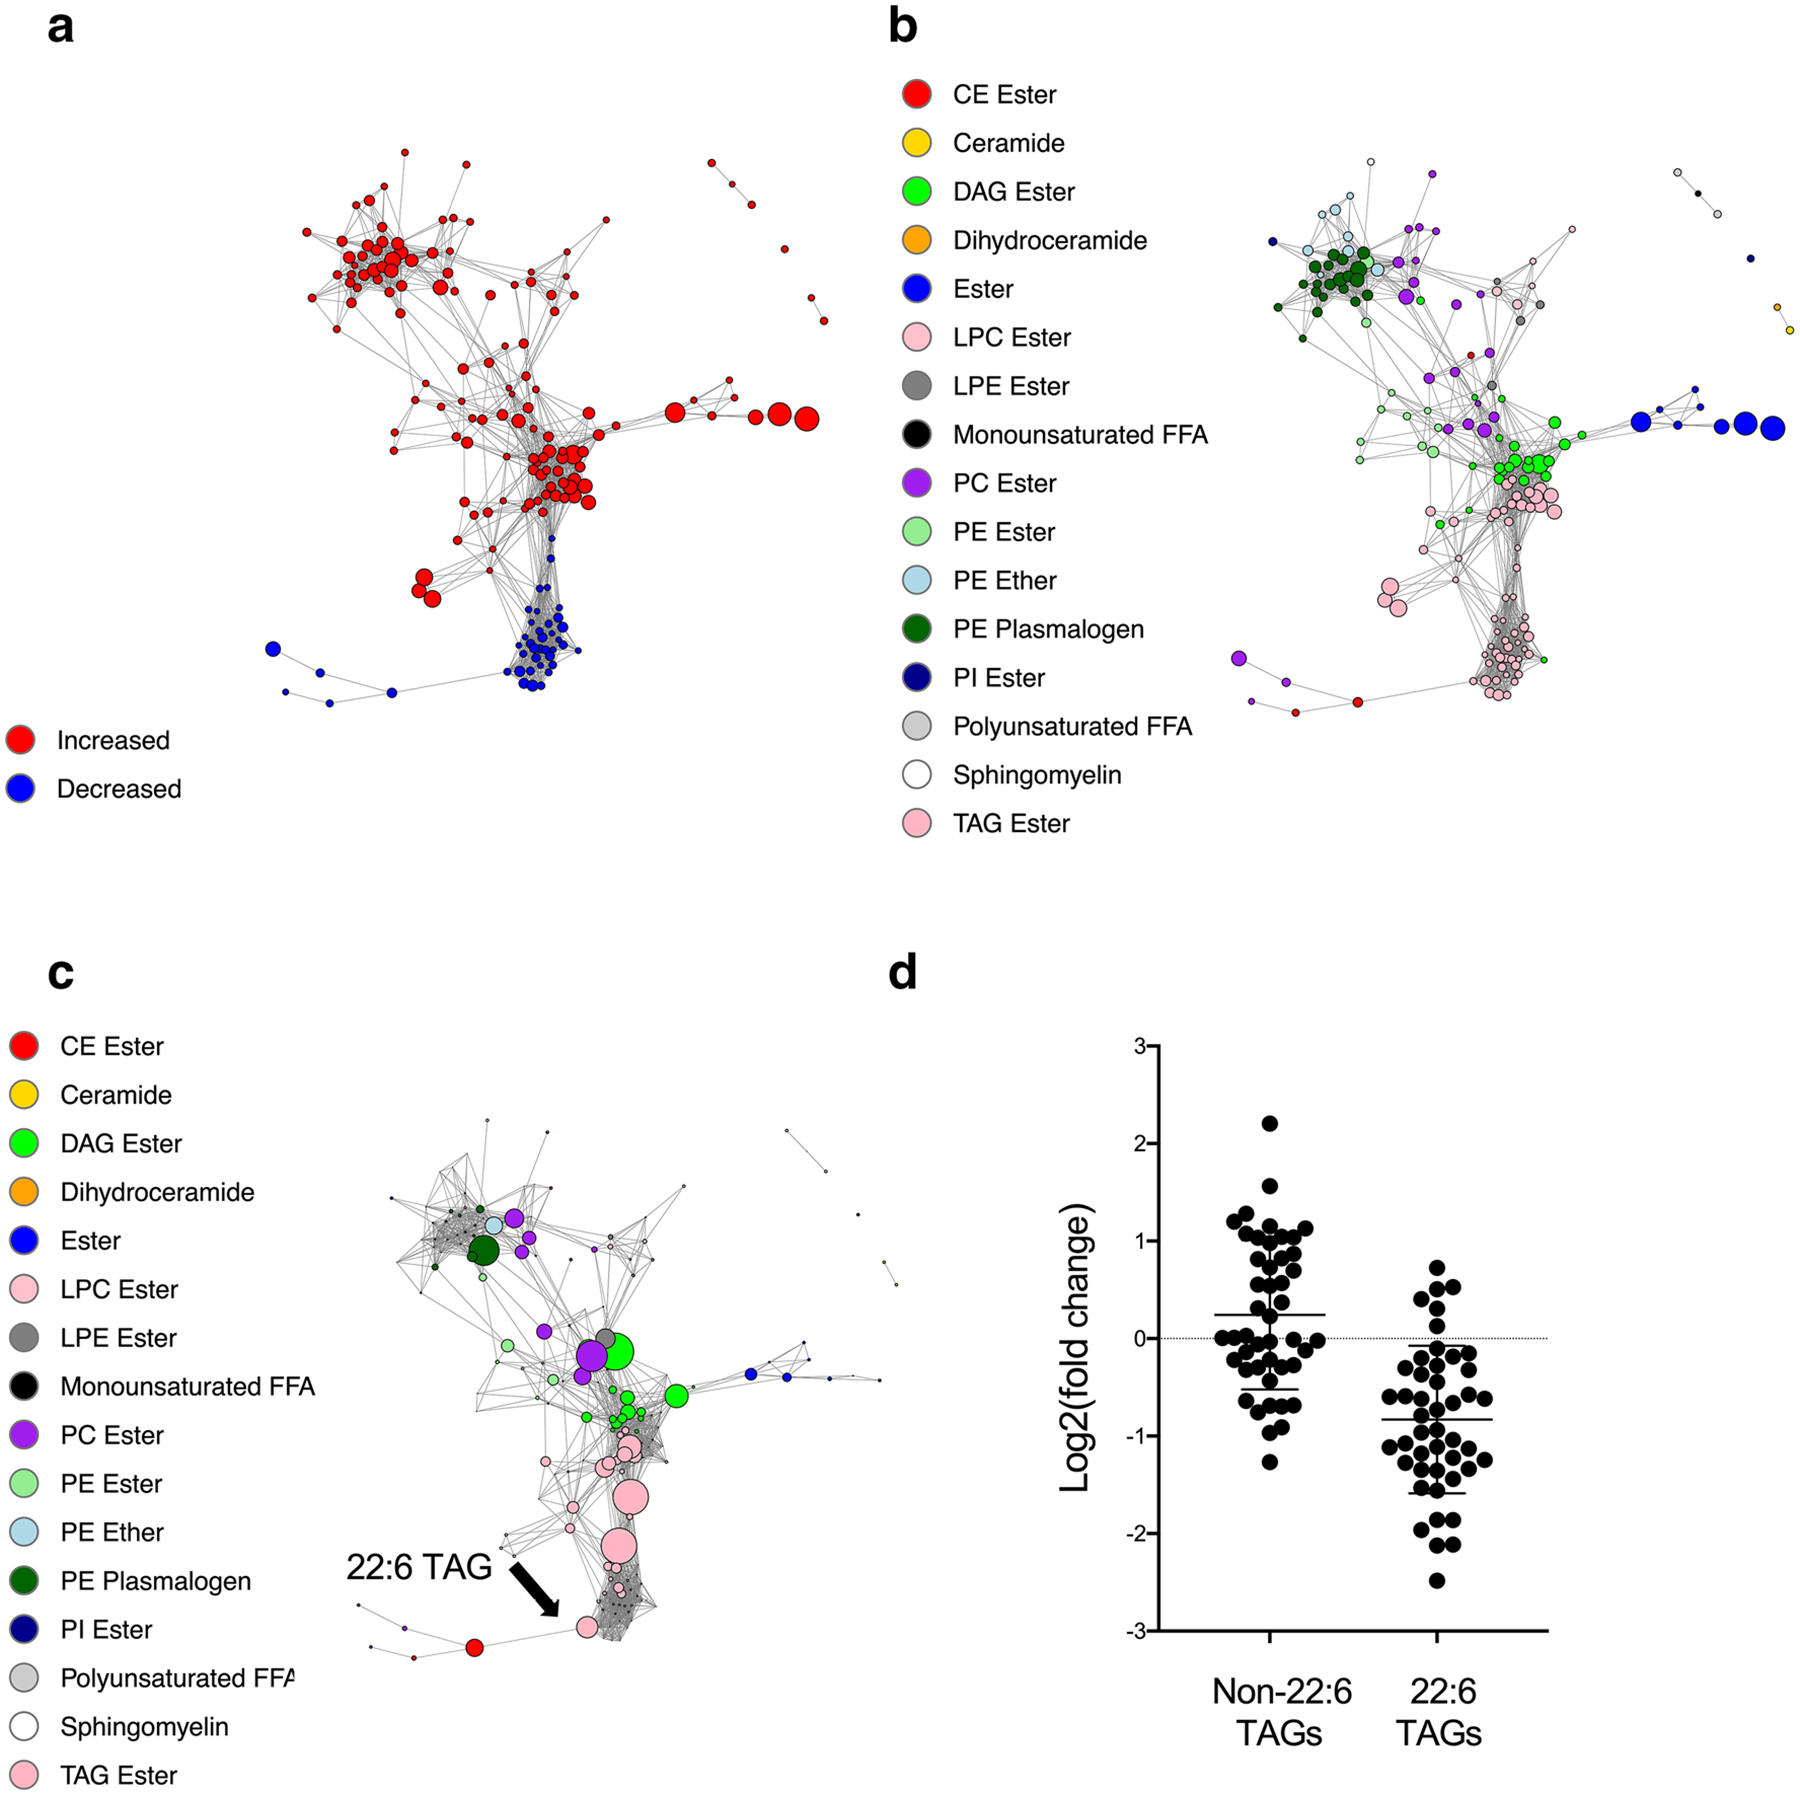
Fig. 5.

Pairwise Spearman correlation networks of altered complex lipids after induction therapy. a Nodes were color-coded based on the directionality of change (increased: red; decreased: blue), and their size represents |log2(fold change)|. b, c Nodes were color-coded by lipid classes, and their size represents |log2(fold change)| (b), or betweenness centrality (c). d Change in non-22:6 TAGs and 22:6 TAGs after induction therapy
