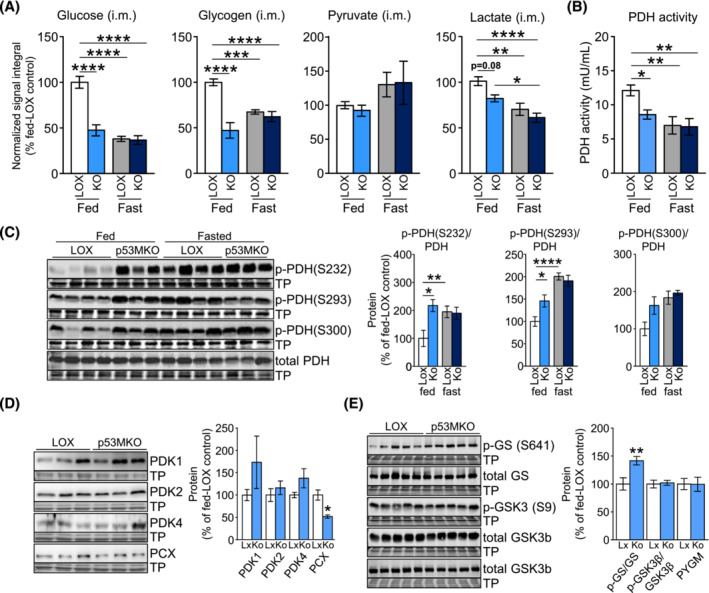
Figure 5.

Acute Trp53 deletion results in depleted intramuscular glucose and glycogen stores. (A) NMR spectroscopic analysis of intramuscular glucose, glycogen, pyruvate, and lactate levels in quadriceps muscle from control (LOX) and p53MKO (KO) mice during fed conditions (LOX: white bars; p53MKO: light blue bars) and following 16 h of food withdrawal (LOX: grey bars; p53MKO: dark blue bars). (B) Pyruvate dehydrogenase (PDH) activity in quadriceps of control and p53MKO mice under fed and fasted conditions. (C) Representative immunodetections (left panels) and quantifications (right panels) of phosphorylated PDH (p‐PDH at residues: S232, S293, and S300) and total PDH in quadriceps muscle under fed and fasted conditions and normalized to total PDH and total protein loading. (D) Representative immunodetections (left panels) and quantifications (right panels) of pyruvate dehydrogenase kinase isoforms (PDK1, PDK2, and PDK4) and pyruvate carboxylase (PCX) in quadriceps muscle under fed and fasted conditions and normalized to total protein loading. (E) Representative immunodetections (left panels) and quantifications (right panels) of glycogen synthase (GS) phosphorylation (p‐GS at S641), total GS, glycogen synthase kinase 3‐beta (GSK3‐beta) phosphorylation (p‐GHSK3b at S9), total GSK3‐beta, and total glycogen phosphorylase (PYGM) in quadriceps muscle under fed and fasted conditions and normalized to total corresponding protein (for p‐GS, p‐GSK3‐beta) and total protein loading. Results presented as mean ± SEM; data in (A)–(C) compared by two‐way ANOVA (n = 8–10); data in (C) and (E) compared by Mann–Whitney test (n = 7–11); *P < 0.05, **P < 0.01, ***P < 0.001, ****P < 0.0001.
