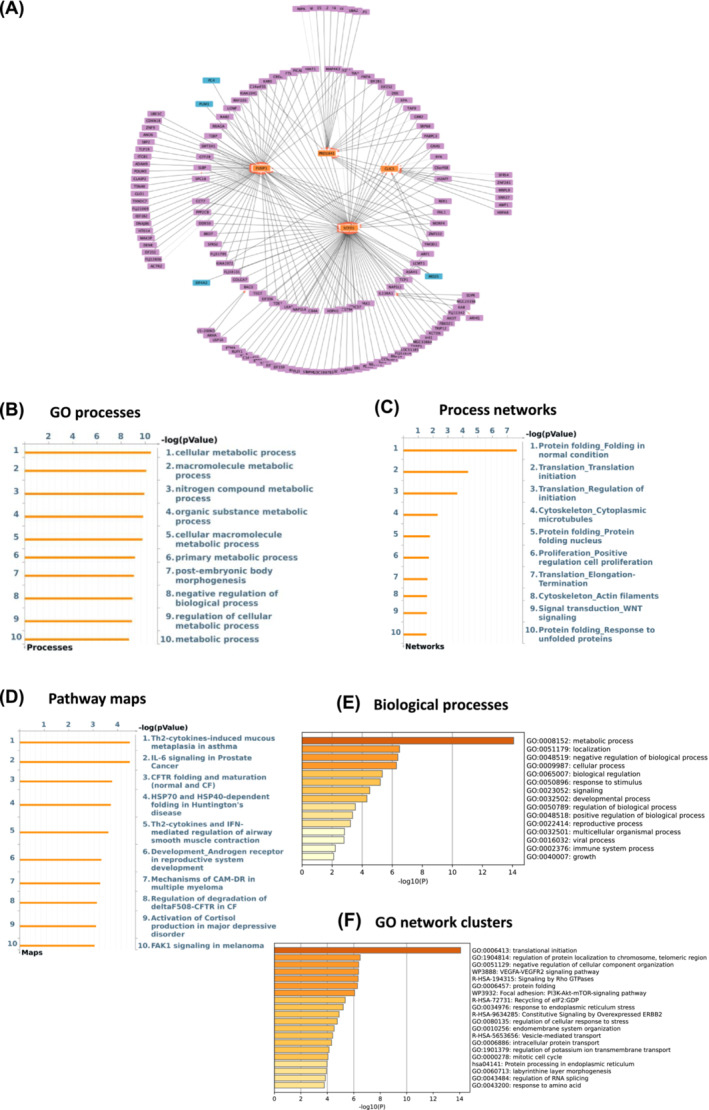
Figure 4.

EIF4A2 and MO25 are the main drivers while SCFD1 and FUSIP1 are top targets in exercised aged muscle based on GSE8479 dataset. (A) Thickness represents the interaction strength, arrows the directionality, the most influencing genes (i.e., drivers) are in blue and the main influencers (i.e., targets) are depicted as orange in the interactome map. (B–D) Charts by Metacore depicting top 10 overrepresented GO cellular processes (B), process networks (C), and pathway maps (D) in response to exercise in older adults. (E, F) Metascape was used to create bar graphs indicating most significantly enriched biological processes (E) and networks clusters of GO terms (F) in exercise responsive genes with the strongest interactions as a result of ANNI analysis.
