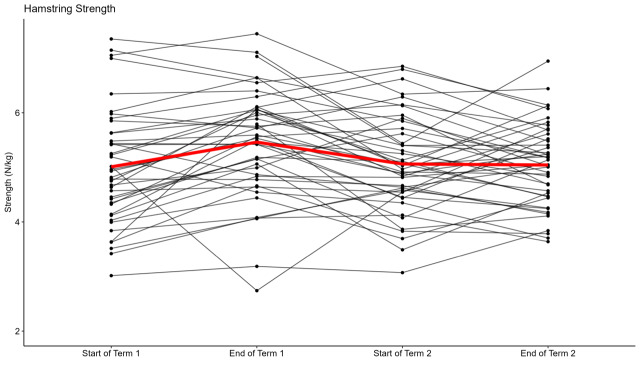
Figure 3. Isometric hamstring strength (N/kg) throughout the study period.
Individual players represented by black lines and group average indicated by the red line. Significant increase from Start of Term 1 to End of Term 1 (p<0.001, 10.7%), and decrease from End of Term 1 to Start of Term 2 (p<0.001, -9.2%).

