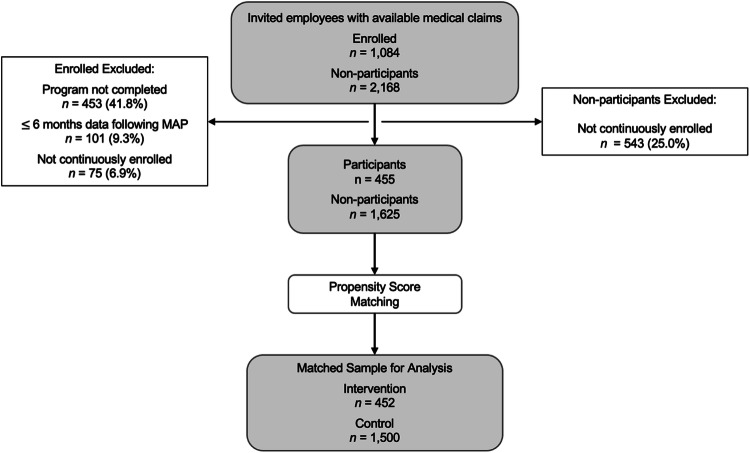
Fig. 1. Flow diagram and cohort construction.
Study population definitions and inclusion/exclusion criteria. Medical and pharmacy claims data were available for 3252 employees invited to the program. Following exclusion criteria (program completion, ≥6 months follow-up time, continuous enrollment), there were 455 participants and 1625 non-participants in the study population. Propensity score matching resulted in the final assignment of 452 to the intervention group and 1500 to the control group which were used for the clinical and economic analysis.

