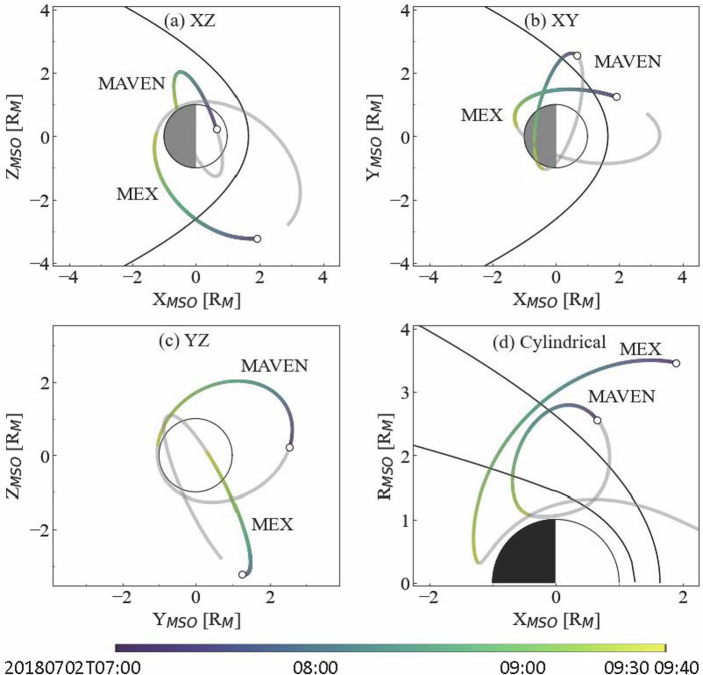
Extended Data Fig. 1. Trajectories of MAVEN and MEX in the MSO coordinate system (the x-axis is directed to the sun, the y-axis is in the Mars orbital plane, perpendicular to the x-axis and opposite to Mars’ motion, and the z-axis completes the right-handed coordinate system).
The colored inbound part of the orbits represents the time interval of this study. The circles show the starting points of the observations. The black lines show the nominal bow shock and induced magnetosphere boundary (IMB) locations as derived by Trotignon et al.28. The colorbar at the bottom denotes the time.

