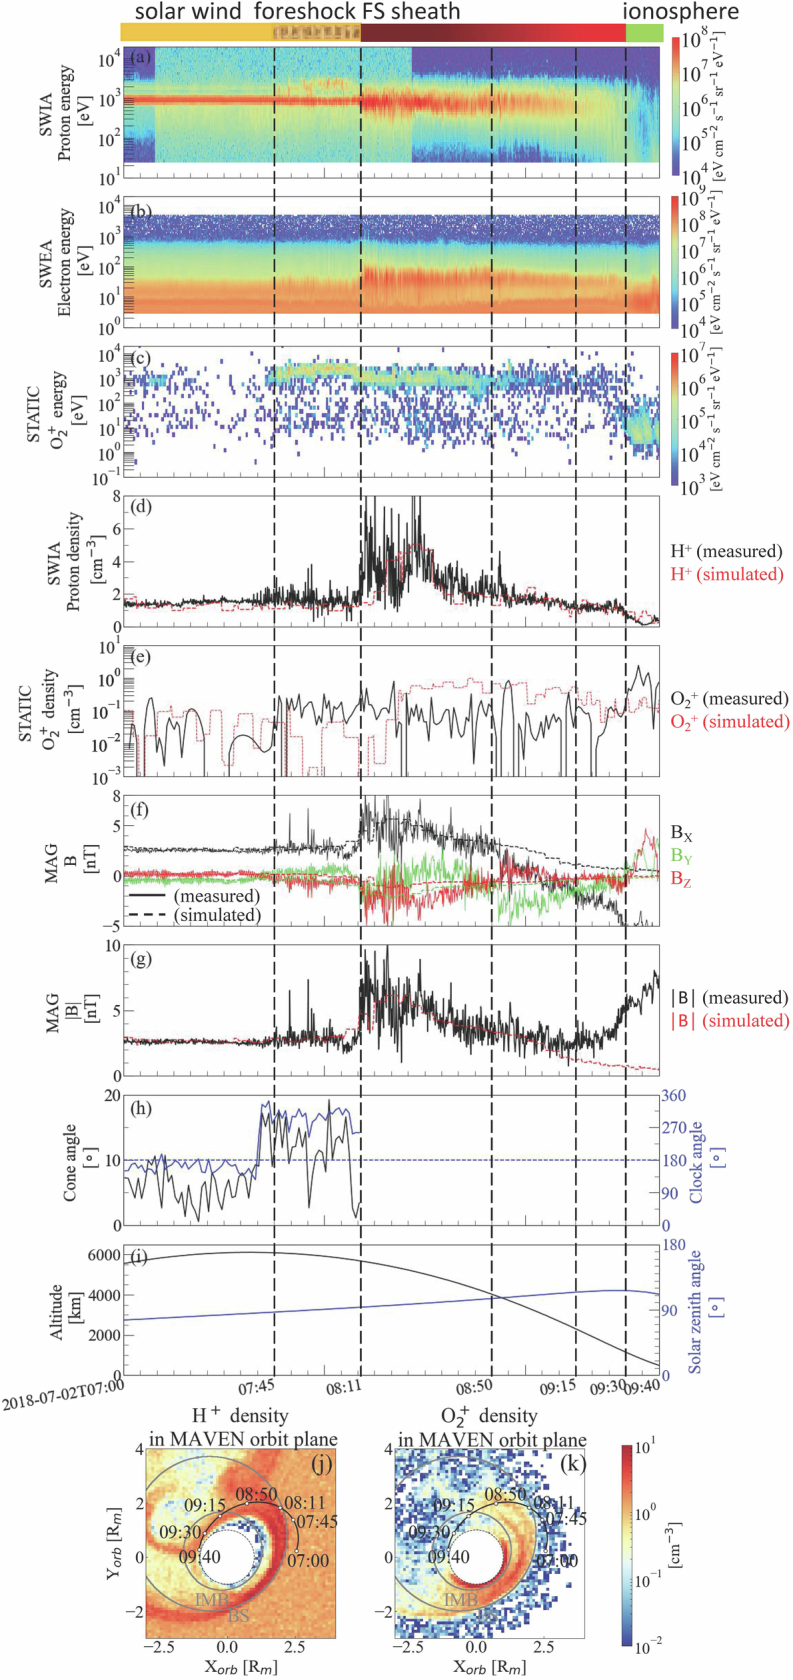
Extended Data Fig. 2. MAVEN observation and comparison with simulation.

The panels show (a) SWIA proton energy spectrum; (b) SWEA electron energy spectrum; (c) STATIC energy spectrum; (d) SWIA and simulated (dashed red line) proton density; (e) STATIC and simulated (dashed red line) density; (f) MAG and simulated (dashed lines) magnetic field vector; (g) MAG and simulated (dashed red line) magnetic field magnitude; (h) cone angle between the solar wind velocity and the interplanetary magnetic field (IMF), and clock angle is the IMF counterclockwise angle from + y-axis in the MSO coordinate; (i) spacecraft altitude and solar zenith angle. The vertical dashed lines mark out the time stamps for the comparison between the measurements and model. Panels at the bottom show the simulated proton density (j) and density (k) in the MAVEN orbit plane. The black lines are the MAVEN trajectories. The grey lines are the nominal bow shock and IMB28 projected in MAVEN orbit plane. The colorbar at the top denotes different plasma domains identified from the measurements. No IMB is identified.
