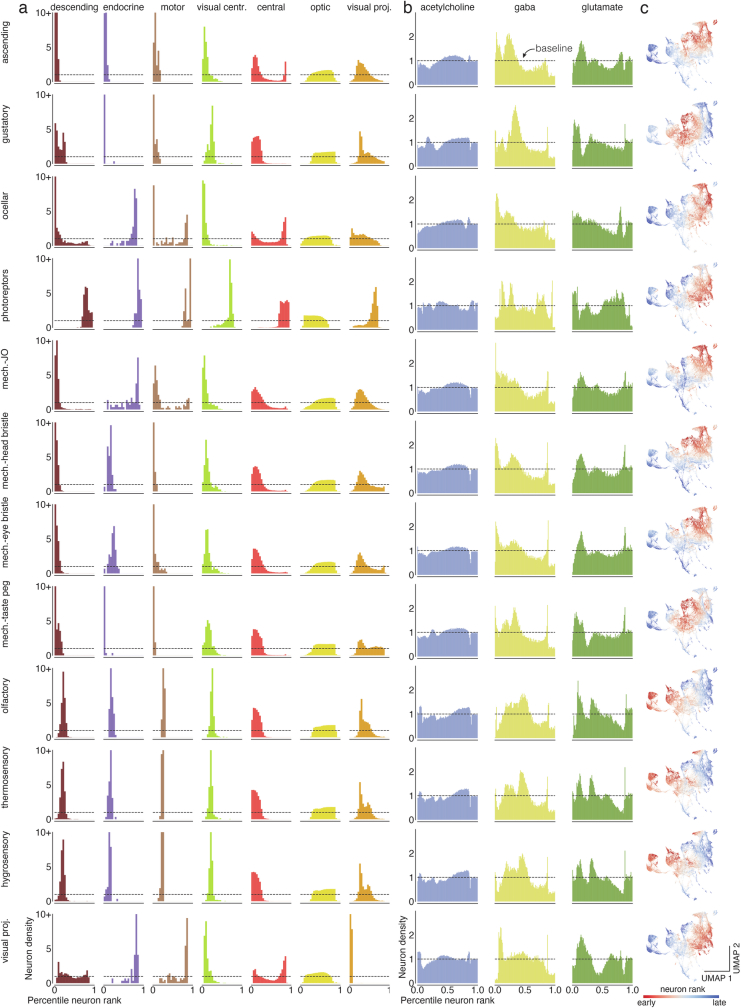
Extended Data Fig. 8. Percentile ranks for every modality.
(a) For each sensory modality (rows) we used the traversal distances to establish a neuron ranking. Each panel shows the distributions of neurons of each super-class within the sensory modality specific rankings. (b) Same as in (a) for the fast neurotransmitters. (c) Neurons in the central brain shown in the UMAP plot are colored by the rank order in which they are reached from a given seed neuron set. Red neurons are reached earlier than blue neurons.

