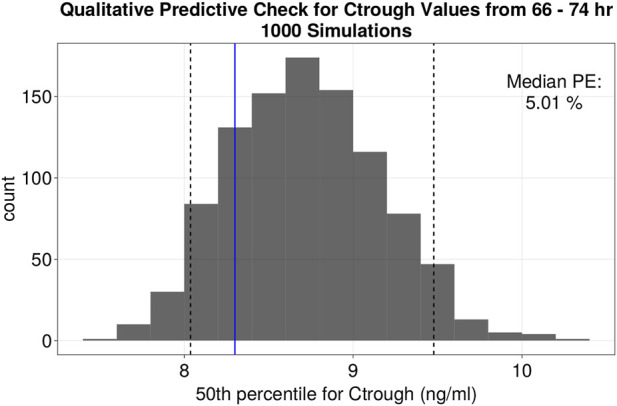
FIGURE 3.

Quantitative predictive check of Ctrough levels at 72 h (66–74 h window). Histogram of the distribution of the median values of Ctrough at 72 h (ng/mL) of 1,000 simulations. Black dotted lines represent the 5th and 95th percentile of the median values from the simulations. The fifth, 50th and 95th percentiles of %PE for Ctrough at 72 h were −3.17, 5.01% and 14.19% respectively.
