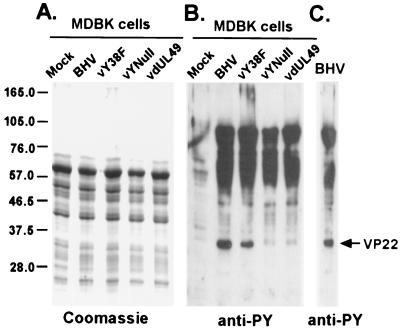
FIG. 7.
Comparison of levels of tyrosine phosphorylation in infected and uninfected cells. Equal amounts of protein from total cell lysates of mock-infected and virus-infected MDBK cells were analyzed by SDS-PAGE and Coomassie blue staining (A) or immunoblotted and probed with polyclonal antiphosphotyrosine antibody (B). Note that, in infected cells (B), tyrosine phosphorylation increased and that the phosphorylated protein bands have patterns and molecular masses similar to those of the purified BHV-1 phosphorylated structural proteins (C). Molecular mass markers are indicated at the left in kilodaltons.

