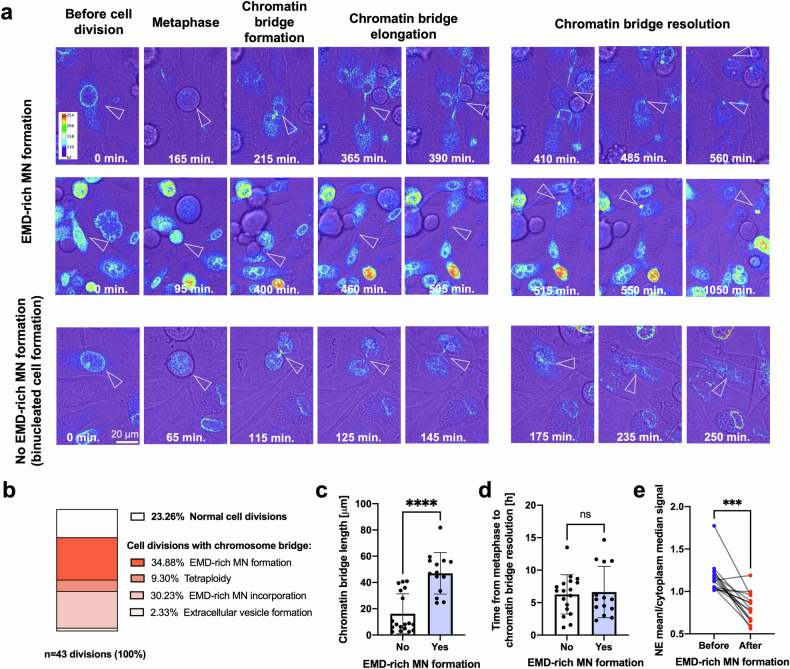
Fig. 3. Emerin-rich (EMD-rich) MN is associated with chromatin bridge resolution.
a Representative micrographs of PC-3 cells transfected with the EGFP-EMD construct showing cell division after IRCF-193 treatment. The arrows indicate chromatin bridges and Emerin-rich MN. b Percentages of events associated with cell division in all imaged cells. c Quantification of chromatin bridge length during cell division in cells with (n = 14) and without (n = 18) the formation of Emerin-rich MN. d Quantification of chromatin bridge persistence during cell division in cells with (n = 14) and without (n = 18) the formation of Emerin-rich MN. e Quantification of the median NE/cytoplasmic Emerin signal ratio before and after the formation of Emerin-rich MN (n = 15). Scatter plot with bar (mean with SD): Mann‒Whitney U-test. Paired analysis: Wilcoxon matched-pairs signed-rank test. *p < 0.05; **p < 0.01; ***p < 0.001; ****p < 0.0001; ns, not significant.

