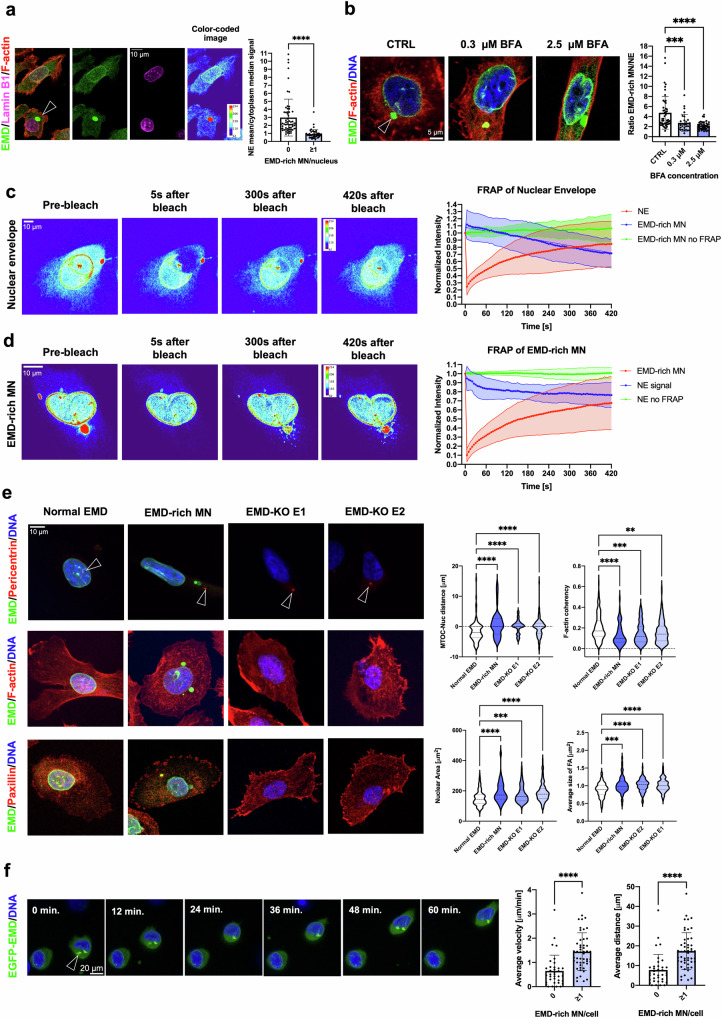
Fig. 4. The formation of Emerin-rich (EMD-rich) MN can induce Emerin pauperization at the NE and lead to the reproduction of the Emerin loss phenotype.
a Quantification of the median NE/cytoplasmic Emerin signal ratio in fixed PC-3 cells with (n = 51) and without Emerin-rich MN (n = 62). b Quantification of the Emerin intensity signal ratio between Emerin-rich MN and the NE in the CTRL (n = 48) and Brefeldin A treatment (0.3 μM (n = 30) and 2.5 μM (n = 40)) groups. c iFRAP analysis of PC-3 cells transfected with the EGFP-EMD construct. The region of the nuclear envelope was subjected to photobleaching (n = 23 cells), and the control cells were not subjected to photobleaching (n = 20 cells). d iFRAP analysis of PC-3 cells transfected with the EGFP-EMD construct. The region of the Emerin-rich MN was subjected to photobleaching (n = 15 cells), and the control cells were not subjected to photobleaching (n = 20 cells). e Quantification of selected parameters in PC-3 cells without Emerin-rich MN, with Emerin-rich MN, with EMD-KO E1 and with EMD-KO E2: nucleus-MTOC distance (n = 123, n = 52, n = 79, n = 106, respectively), F-actin coherency (n = 145, n = 66, n = 136, n = 167, respectively), nuclear area (n = 123, n = 52, n = 79, n = 106, respectively), and focal adhesion size (n = 221, n = 73, n = 130, n = 141, respectively). f Assessment of the migratory potential of PC-3 cells transfected with EGFP-EMD with (n = 50) and without (n = 36) Emerin-rich MN. The average cell velocity and distance were calculated from individual paths. Scatter plot with bar (mean with SD): Mann–Whitney U-test. Violin plot: minimum to maximum values, specifically, the first quartile, median, and third quartile values. For comparisons among more than two groups, the Kruskal‒Wallis test was used. *p < 0.05; **p < 0.01; ***p < 0.001; ****p < 0.0001; ns, not significant.

