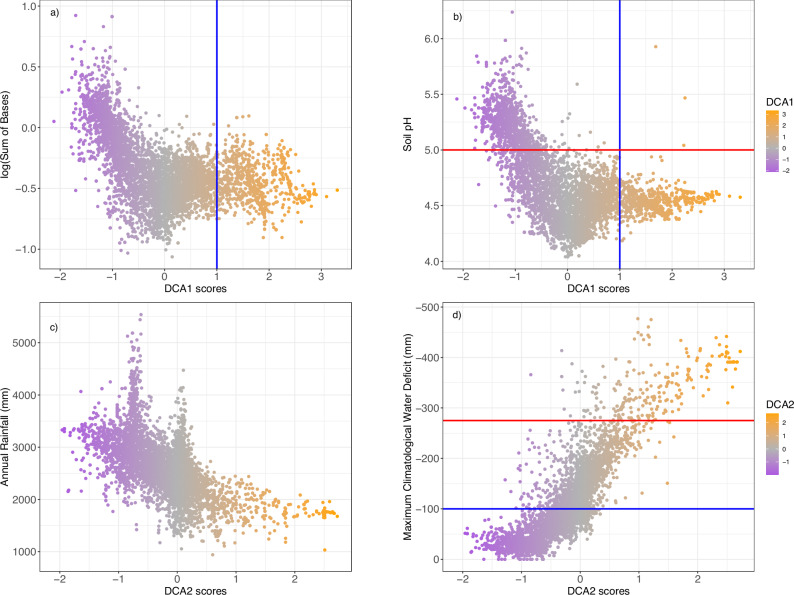
Fig. 5. The associations of species niche positions on compositional and environmental gradients.
In the first row the species niche positions on the DCA1 scores gradient in relation to edaphic niche position gradients: (a) Soil sum of bases, (b) Soil pH. The second row shows the species niche positions along the DCA2 scores gradient in relation to climatic gradients: (c) Annual Rainfall, (d) Maximum climatological water deficit. Plot colours correspond to colours in Fig. 3. Coloured lines correspond to the lines (DCA1, pH, MCWD) also visible in Fig. 3.

