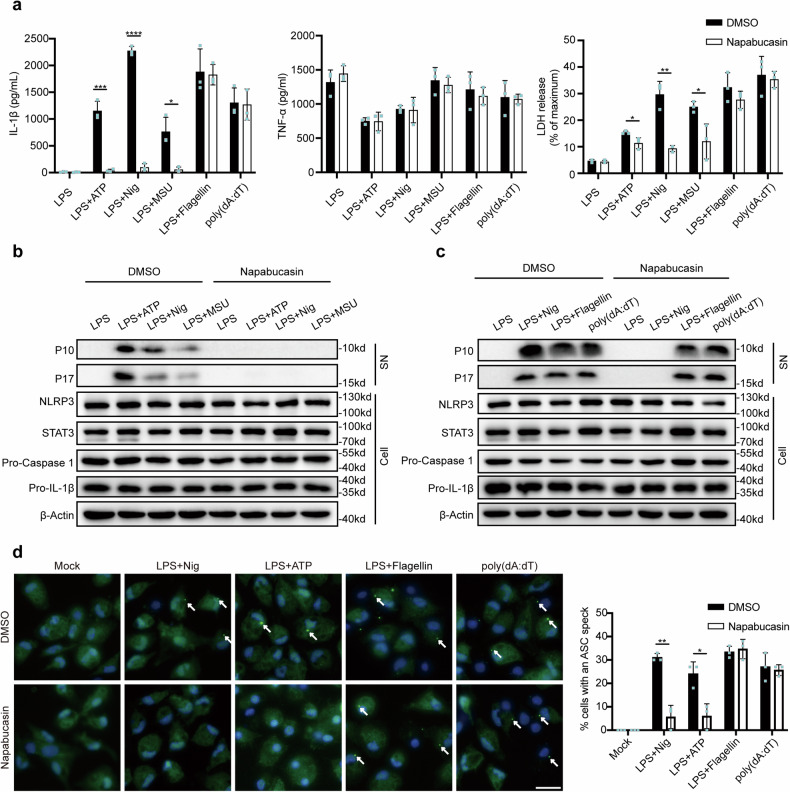
Fig. 2. Napabucasin specifically suppresses NLRP3 inflammasome activation.
a ELISA of IL-1β and TNF-α secretion and assay of LDH release in supernatants from LPS-primed mouse peritoneal macrophages treated with 10 μM napabucasin for 30 min followed by the indicated stimulators of different inflammasomes. The experiments were repeated at least three times, and representative data are shown. b, c Immunoblot analysis of supernatants (SN) or cell lysates (Cell) from mouse peritoneal macrophages treated with the indicated stimulators of the NLRP3 (b), NLRC4 or AIM2 inflammasome with or without napabucasin (c). d Representative images of ASC specks in peritoneal macrophages treated with the indicated stimuli; ASC, green; nuclei, blue. The white arrows indicate ASC specks. Scale bar: 20 μm. The percentage of cells containing an ASC speck was quantified (right). At least 100 peritoneal macrophages from each genotype were analyzed. The results are presented as the means ± SDs, and representative photographs from three biologically independent experiments with similar results are shown. Statistical analyses were carried out via two-way ANOVA with the Bonferroni correction in (a, d). *P < 0.05, **P < 0.01 and ***P < 0.001.

