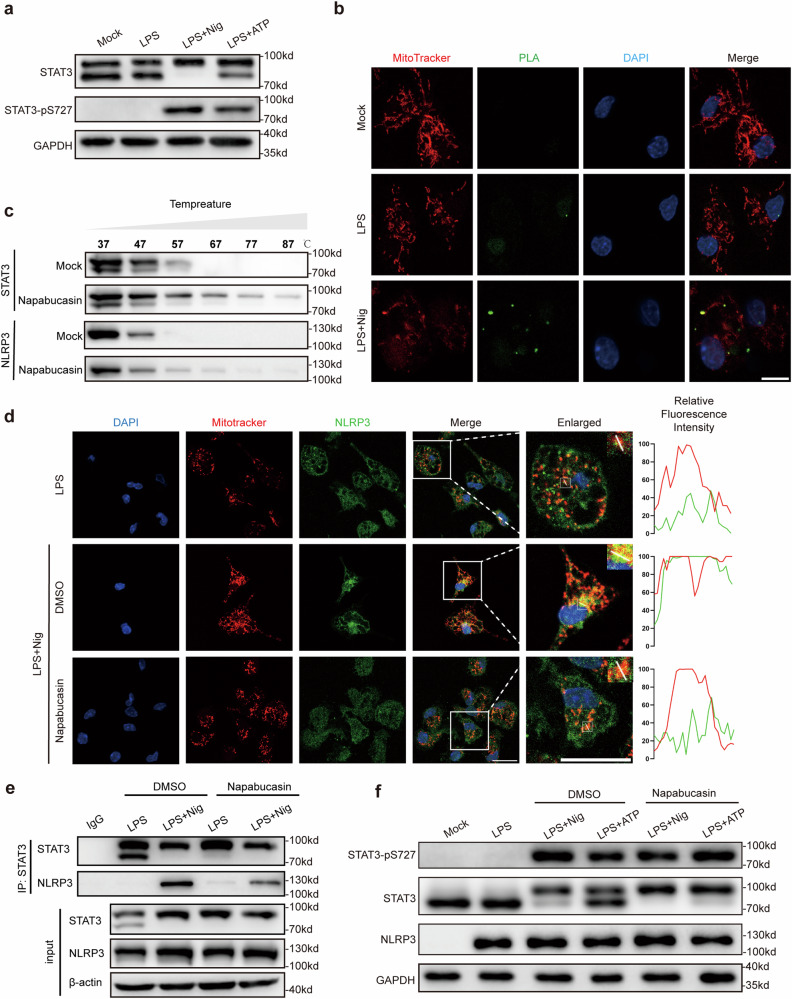
Fig. 5. STAT3 transports NLRP3 to mitochondria.
a Immunoblot analysis of cytoplasmic components using a cytoplasmic and nuclear fractionation kit after treatment with the corresponding stimuli described above. b The interaction between NLRP3 and STAT3 and the co-localization with mitochondria (red) in peritoneal macrophages were visualized by a PLA (green) and confocal microscopy. Scale bar: 10 μm. c Cellular thermal shift assay (CETSA) of STAT3 or NLRP3 with napabucasin (20 μM). d LPS-primed peritoneal macrophages were treated with the indicated stimuli. The colocalization of NLRP3 with mitochondria was visualized by immunofluorescence microscopy. Mitochondria were stained with MitoTracker CMXRos, NLRP3 was detected with Alexa Fluor 488, and cellular nuclei were stained with DAPI. The imaging data are representative of several images from three independent experiments. Scale bar: 20 μm. e Immunoprecipitation and immunoblot analysis of lysates from mouse peritoneal macrophages treated with the indicated stimuli with or without napabucasin (10 μM) prior to IP with an anti-STAT3 antibody and immunoblotting with an anti-NLRP3 antibody. f Cytoplasmic components were extracted with a cytoplasmic and nuclear extraction kit after stimulation as described above and were then analyzed by Western blotting. The results are presented as the means ± SDs, and representative photographs of three biologically independent experiments with similar results are shown.

