Figure 1.
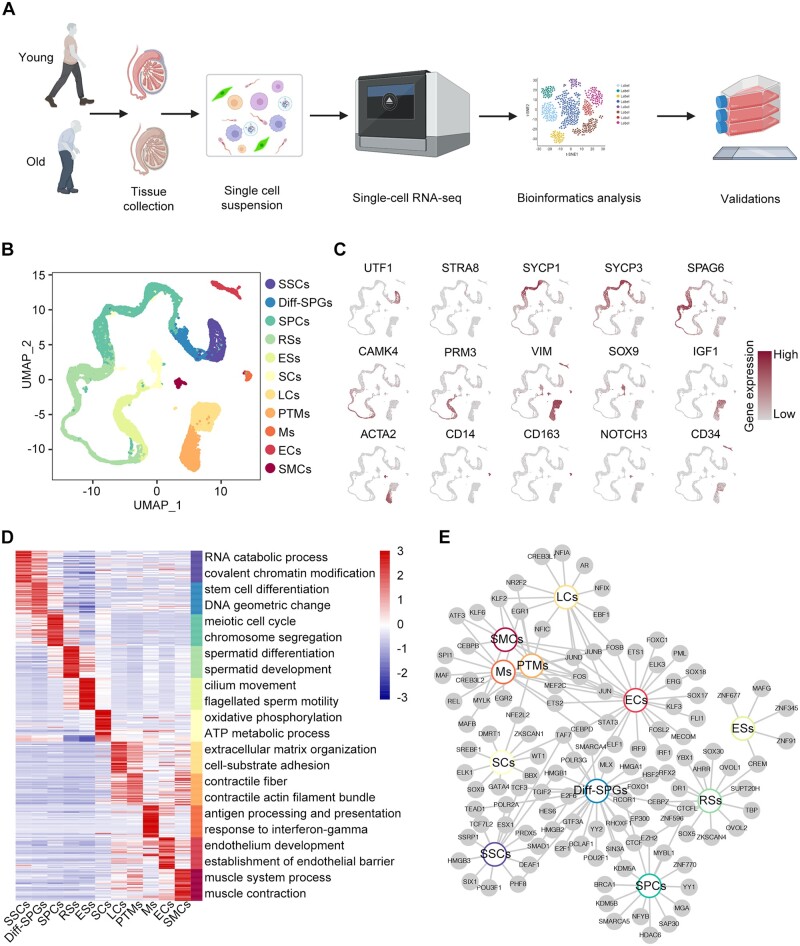
Construction of a single-cell transcriptomic atlas of human testis. (A) Flow chart of scRNA-seq and bioinformatics analysis of the human testis. (B) UMAP plot showing the distribution of 11 different cell types in the human testis, with annotation. (C) UMAP plot showing the expression profiles of the indicated cell type-specific marker genes for the assessed cell types in the human testis. The colour key, ranging from grey to brown, indicates low to high gene expression levels, respectively. (D) Heatmap showing the expression profiles of the top 30 cell type-specific marker genes of different cell types, with their enriched functional annotations on the right. The value for each gene represents scaled data. (E) Network plot showing transcriptional regulators of cell type-specific marker genes (P-value < 0.05, |logFC| > 0.4, min.pct = 0.5) for different cell types in the human testis. UMAP, uniform manifold approximation and projection; SSCs, spermatogonial stem cells; Diff-SPGs, differentiating spermatogonia; SPCs, spermatocytes; RSs, round spermatids; ESs, elongating spermatids; SCs, Sertoli cells; LCs, Leydig cells; PTMs, peritubular myoid cells; Ms, macrophages; ECs, endothelial cells; SMCs, smooth muscle cells.

