Figure 3.
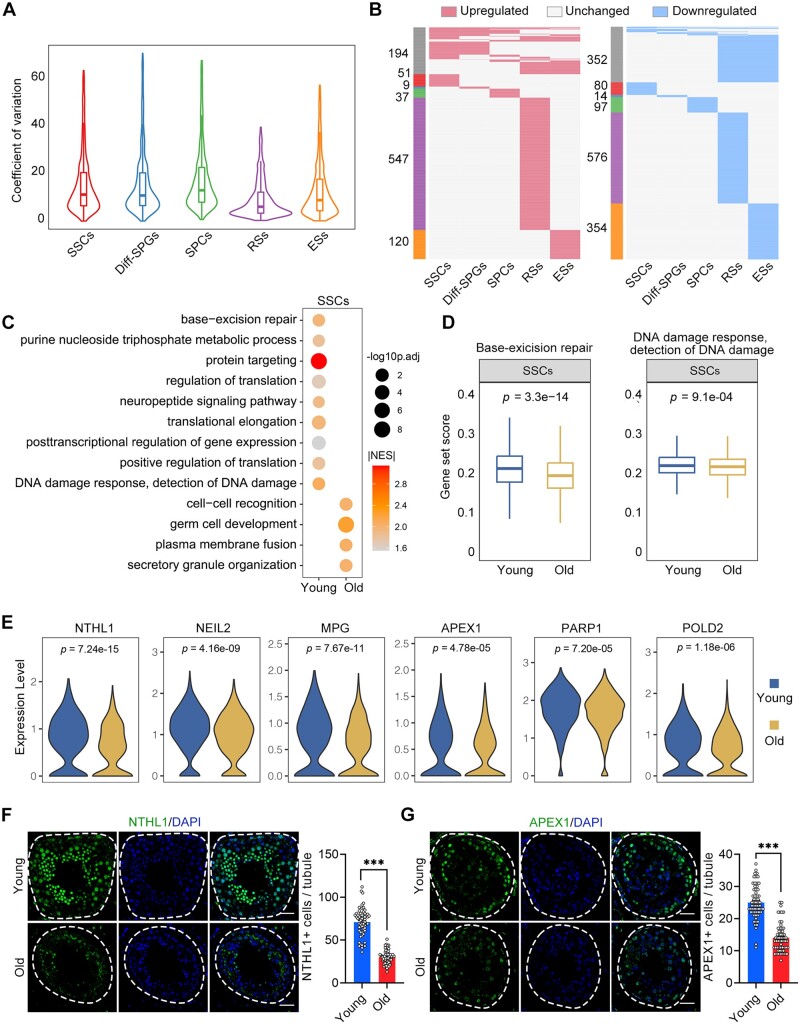
Ageing-related molecular alterations along the trajectories of the spermatogenesis. (A) CV analysis showing the ageing-associated transcriptional noise in germ cells. (B) Heatmaps showing the distribution of upregulated (red) and downregulated (blue) DEGs (log2FC > 0.25, min.diff.pct = 0.1, P-value < 0.05) between old and young germ cells. Genes that are not differentially expressed are indicated in grey, and the numbers of DEGs are indicated. The grey bars on the left of the heatmaps denote DEGs shared by at least two cell types, and the others are cell-specific DEGs. (C) Representative GO terms of DEGs in old and young human SSCs. Dot size indicates the range of −log10(adjusted P-value). Colour keys, ranging from grey to orange to red, indicate the absolute value of the NES. (D) Gene set score analysis for the ‘BER’ and ‘DNA damage response, detection of DNA damage’ signalling pathways of SSCs from the young and old groups. Wilcoxon rank sum test was used; P-value is indicated. (E) Violin plot showing the expression levels of BER-associated genes for SSCs in young and old samples. (F) Immunostaining and quantification of NTHL1 in young and old human testis sections. Left, representative image of NTHL1 in human testis sections. Right, quantification of NTHL1-positive cells in seminiferous tubules of young and old human testis sections. Scale bars, 35 μm. Bars represent the mean with SEM of 60 independent tubules per group (Young, n = 10 samples; Old, n = 10 samples). Significance was determined by Student’s t-test. ***P < 0.001. (G) Immunostaining and quantification of APEX1 in young and old human testis sections. Left, representative image of APEX1 in human testis sections. Right, quantification of APEX1+ cells in seminiferous tubules of young and old human testis sections. Scale bars, 35 μm. Bars represent the mean with SEM of 60 independent tubules per group (Young, n = 10 samples; Old, n = 10 samples). Significance was determined by Student’s t-test. ***P < 0.001. CV, coefficient of variation; NES, normalized enrichment score; GO, gene ontology; DEGs, differentially expressed genes; BER, base-excision repair.

