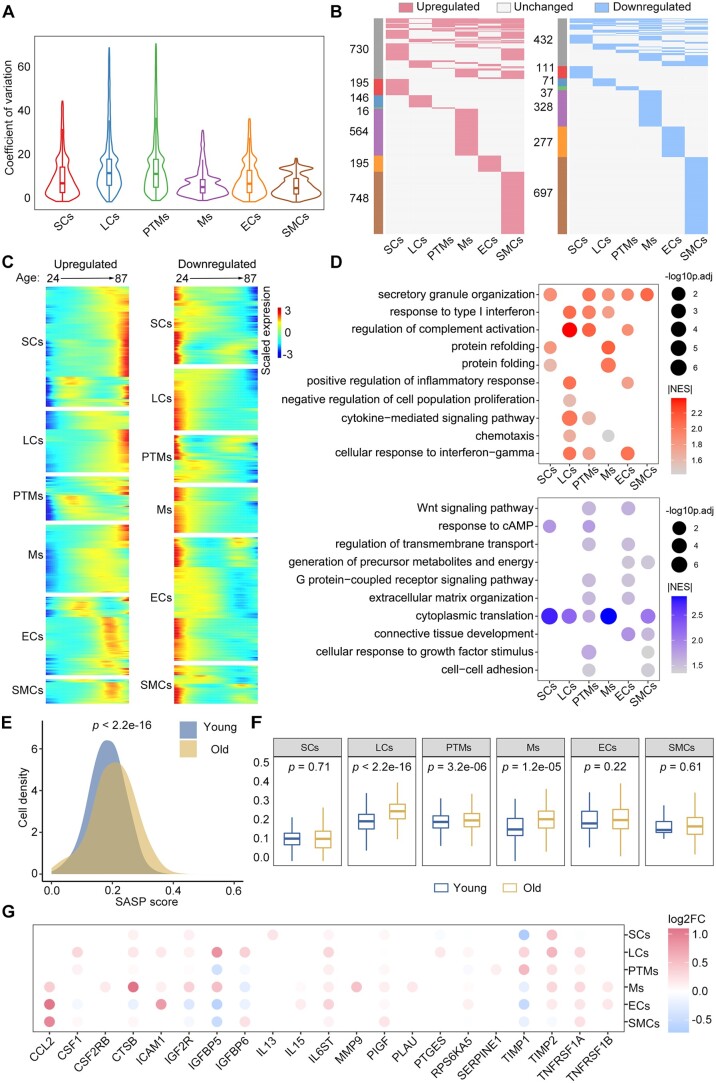
Figure 4.
Changes in the transcriptional profiles of somatic cells during human testicular ageing. (A) CV analysis showing ageing-associated transcriptional noise in somatic cells. (B) Heatmaps showing the distribution of upregulated (red) and downregulated (blue) DEGs (|log2FC| > 0.25, min.diff.pct = 0.1, P-value < 0.05) between old and young human somatic cells. Genes not differentially expressed are in grey, and the numbers of DEGs are indicated. (C) Heatmaps showing the age-related upregulated (left) and downregulated (right) DEGs of somatic cell types. The colour key, ranging from blue to red, indicates low to high gene expression levels. (D) Representative shared GO terms of age-related upregulated (top) and downregulated (bottom) DEGs in different somatic cell types. Dot size indicates the range of −log10(adjusted P-value). The colour keys, ranging from grey to red (top) or from grey to blue (bottom), indicate the absolute values of the NES. (E) Density plot showing the distribution of cells with different SASP scores in the young and old groups. The Wilcoxon rank sum test was used; P-value is indicated. (F) Box plot showing SASP scores in different types of somatic cells. Wilcoxon rank sum test was used; P-values are indicated. (G) Dot plot showing the log2-transformed fold change of SASP-related genes in somatic cells from young versus old groups. Only genes showing a statistically significant difference between the young and old groups are shown. Dot colour indicates the log2-transformed fold change. CV, coefficient of variation; GO, gene ontology; DEGs, differentially expressed genes; NES, normalized enrichment score; FC, fold change; SASP, senescence-associated secretory phenotype.

